All good projects will eventually need to be debugged. This is a walk through from starting in CubeMX through to setting up debugging using either a UART or the SWO trace cell in the cortex-M ARM core.
This was setup and tested on the black STM32F407VET6 development boards that feature a full size JTAG connector. I’m using a Segger J-Link here, however this works the same using the ST STLinkV2 as far as I’m aware.
Setting up STM32 CubeMX
When you first open the CubeMX software, you first press the New Project button and you will be presented with the following.
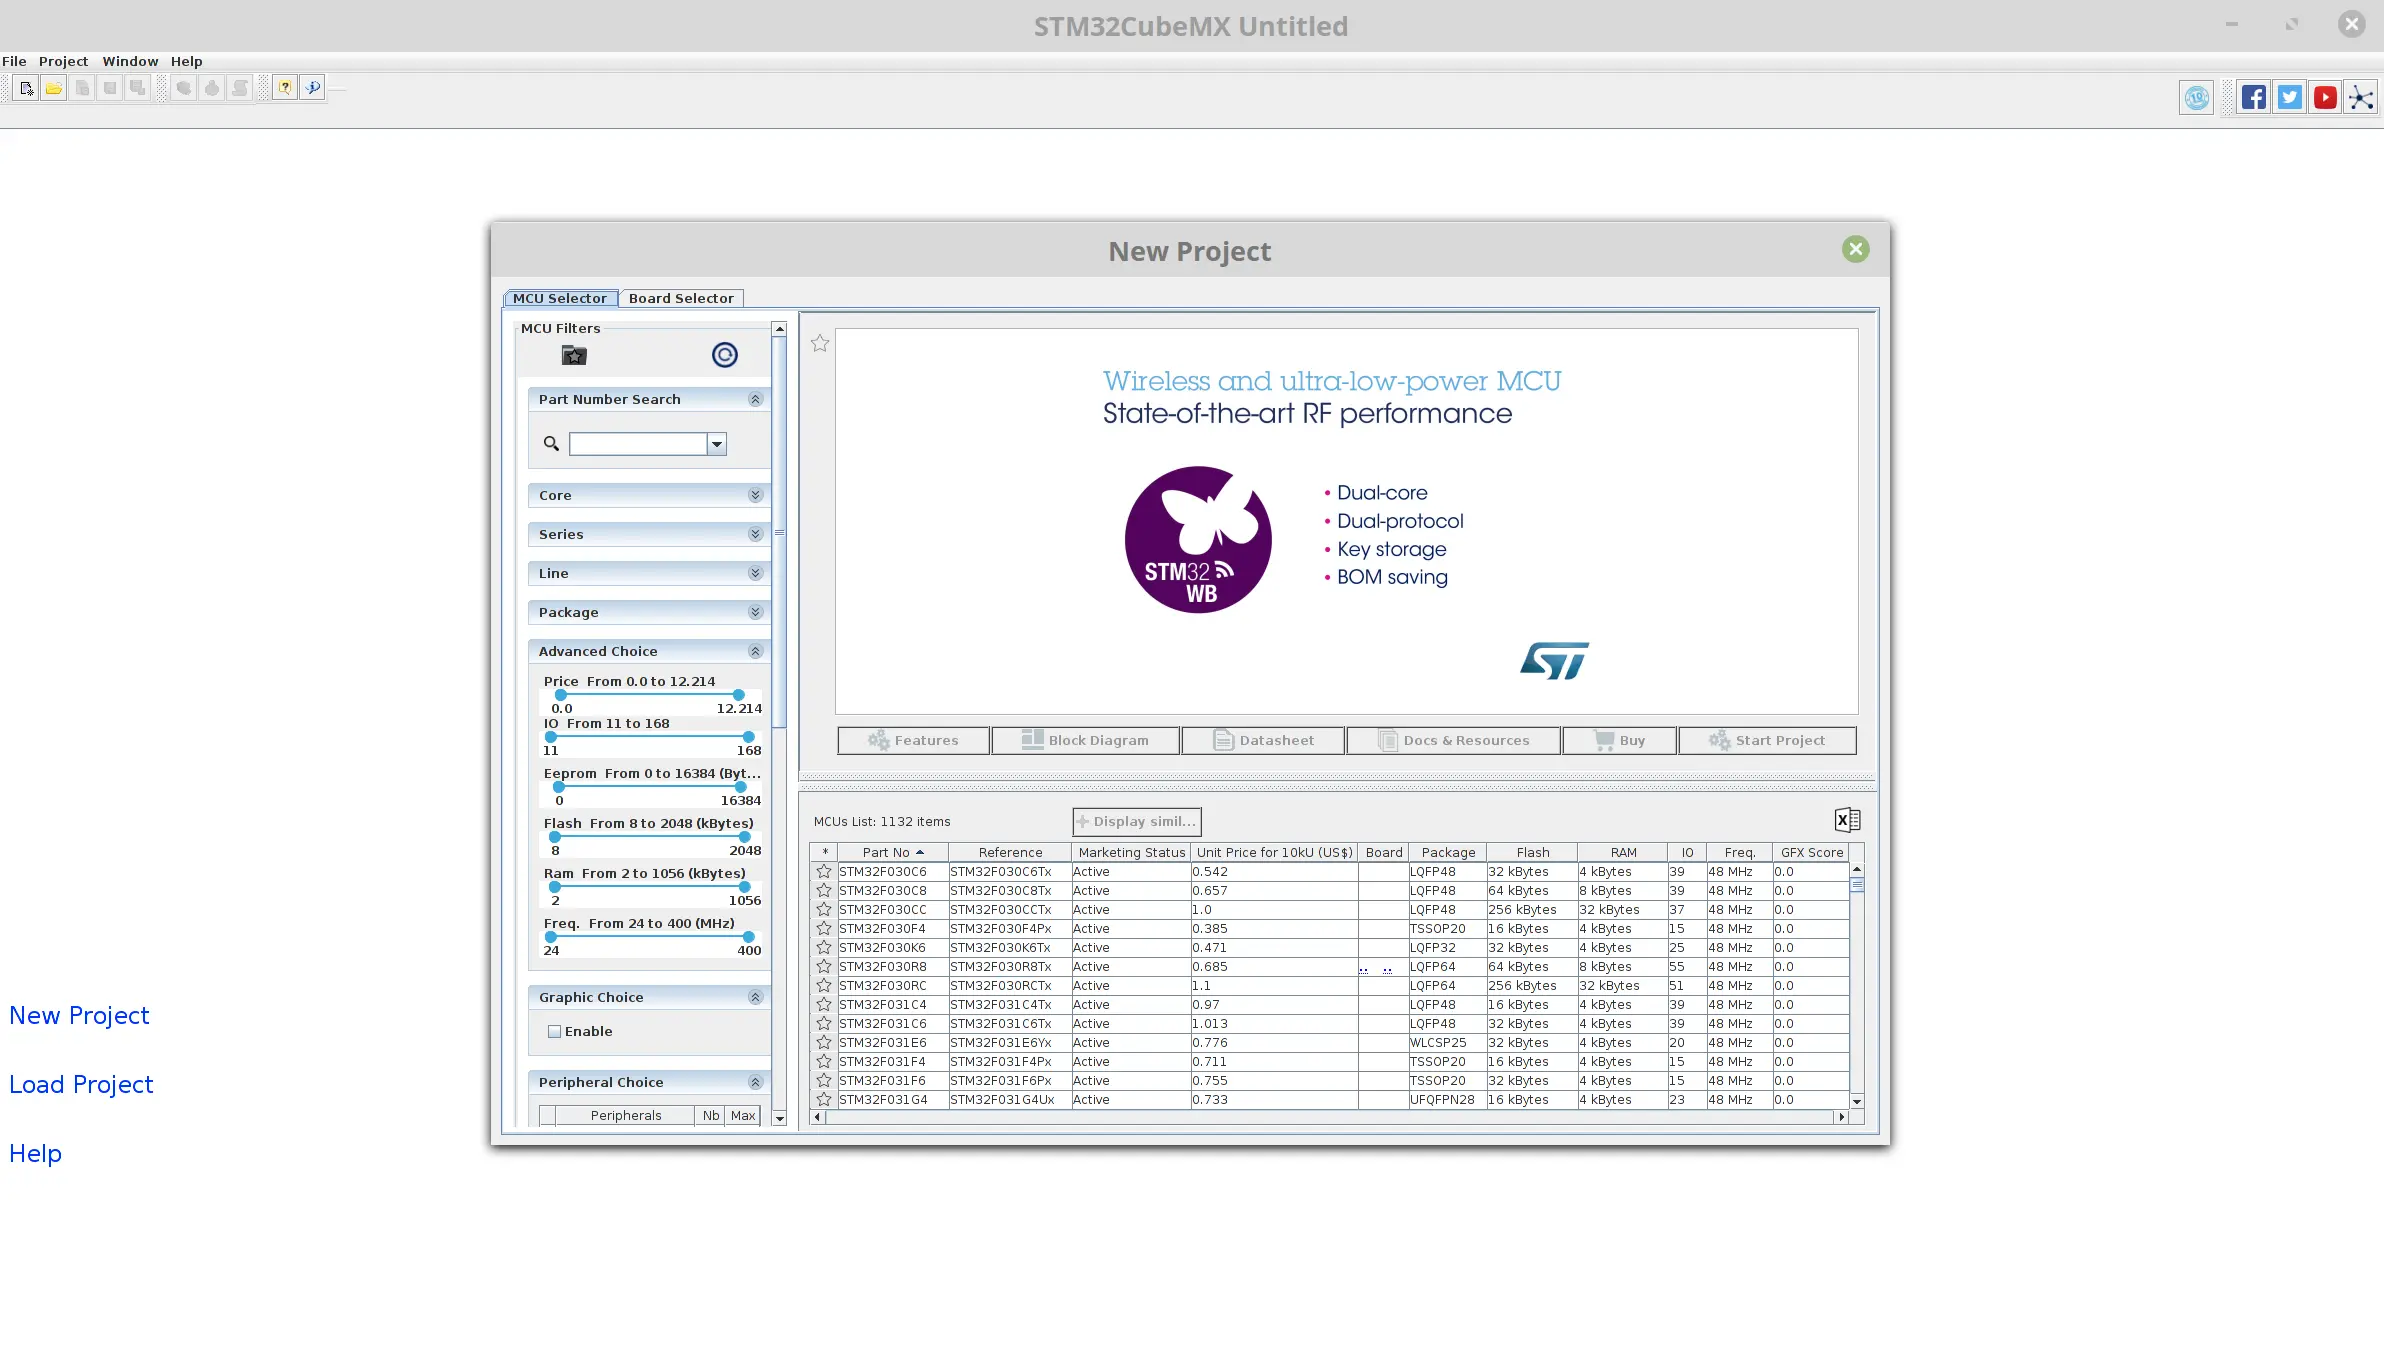
Starting a New CubeMX Project
If you were selecting an MCU from scratch, the software offers a parametric search that you can use to narrow down the models of MCU available to you. I always reccomend taking everything shown here with a grain of salt, but it is very useful.
We can enter in our part number (407VET) to the search box to narrow down to the IC we have on our development board. Double click on the chosen part to start your design.
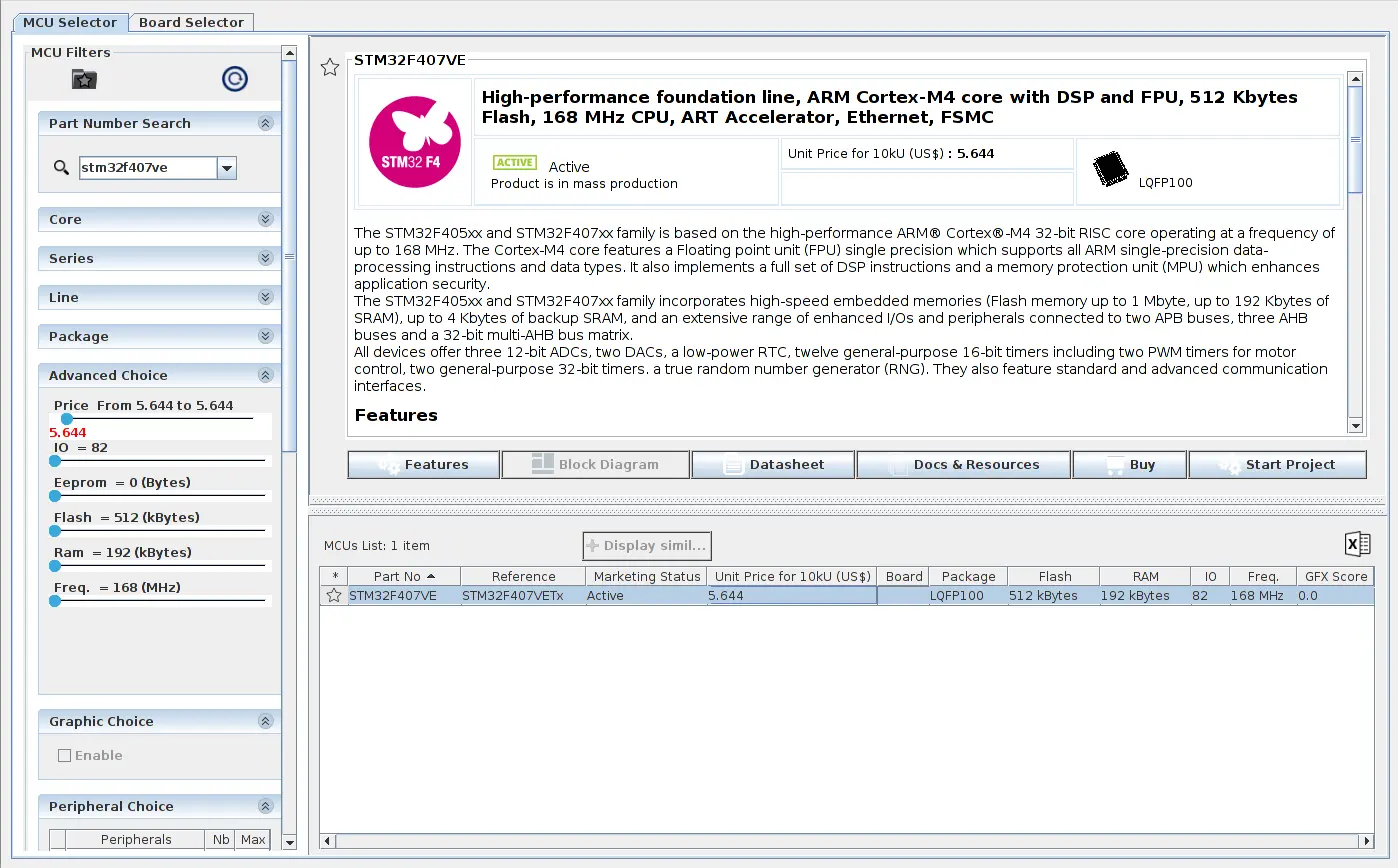
Double click on the chosen part to select it
This now lands us at this blank screen, where we can start to setup our IC. The left column lets you turn on and off peripherals, and setup some of the settings. The top section also allows turning on selected Middlewares which are pre-made software stacks that the CubeMX software can generate for you.
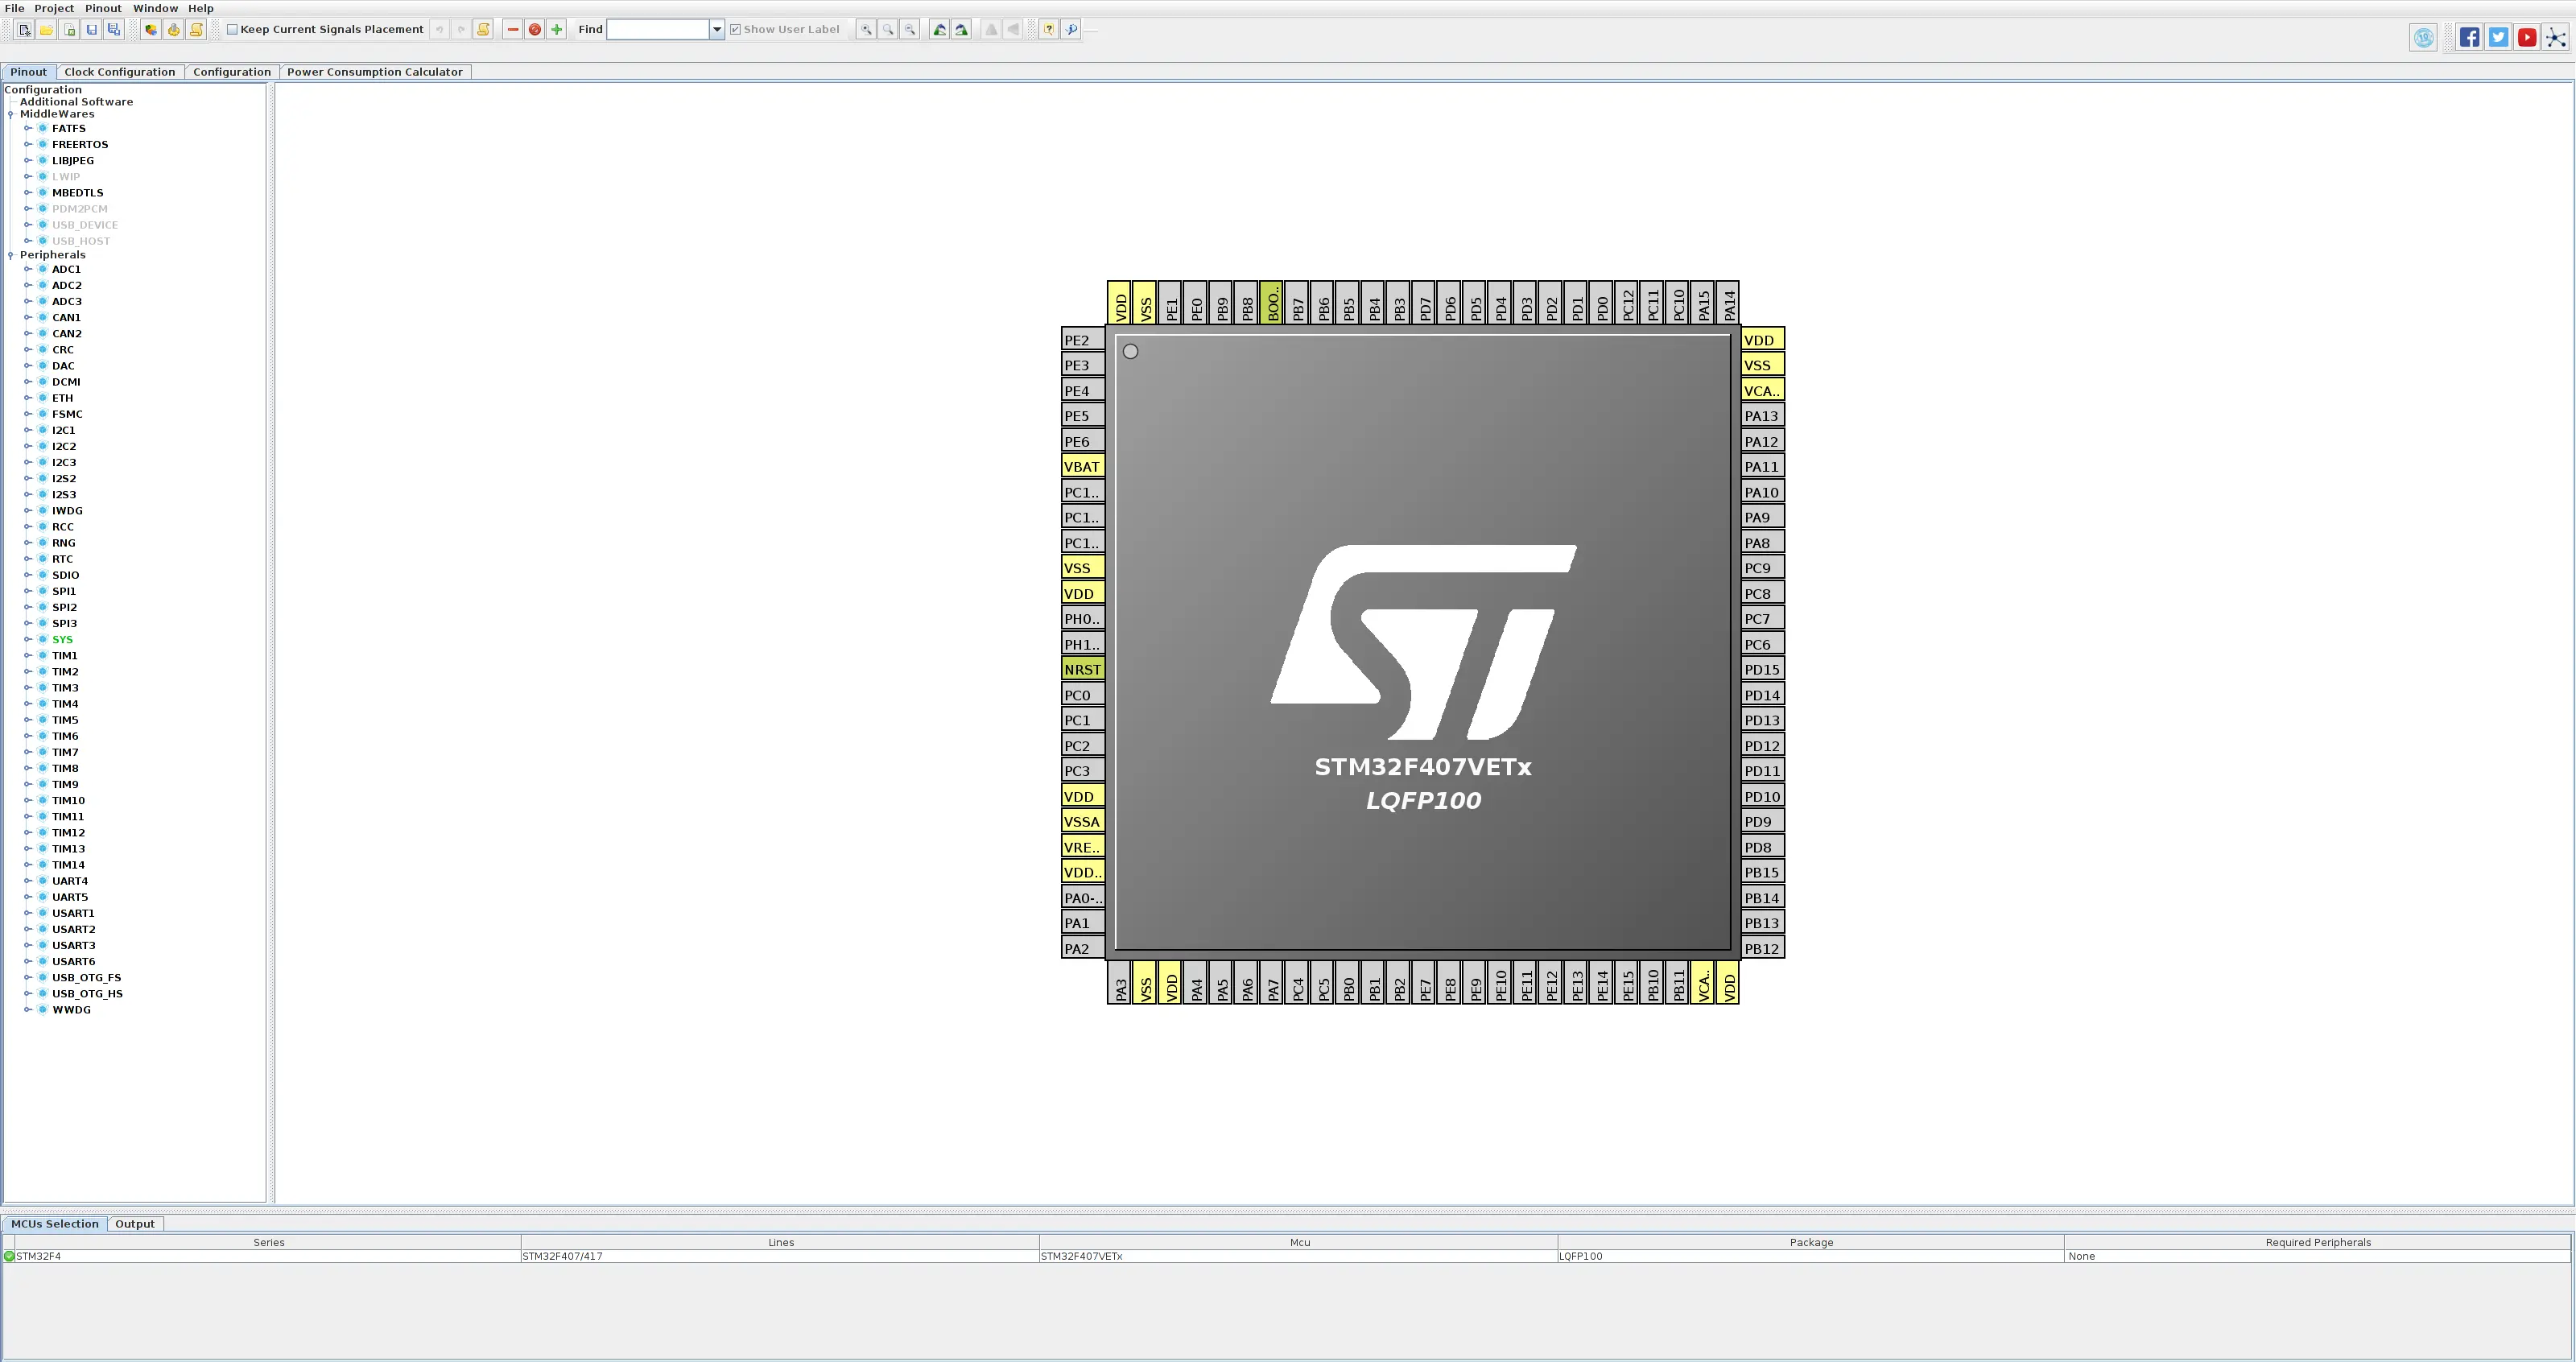
Blank IC Pinout
There are two common ways to setup pins in this software.
If you left click on a pin, you will see a menu appear of all the peripheral options supported on that pin. You can select these and the pin will be assgined to that function.
Alternately you can turn on options in the left hand column and they will appear on the pinout to the right.
If when doing this, a peripheral maps to a location you can’t use, you can hold the Ctrl key and drag the pin to try and move that allocation. The software will then show in blue the valid pins to move it to.
If a pin is shown in orange, it means that the pin is mapped, the the peripheral its mapped to is not setup correctly, and when you generate code you will not be able to use it.
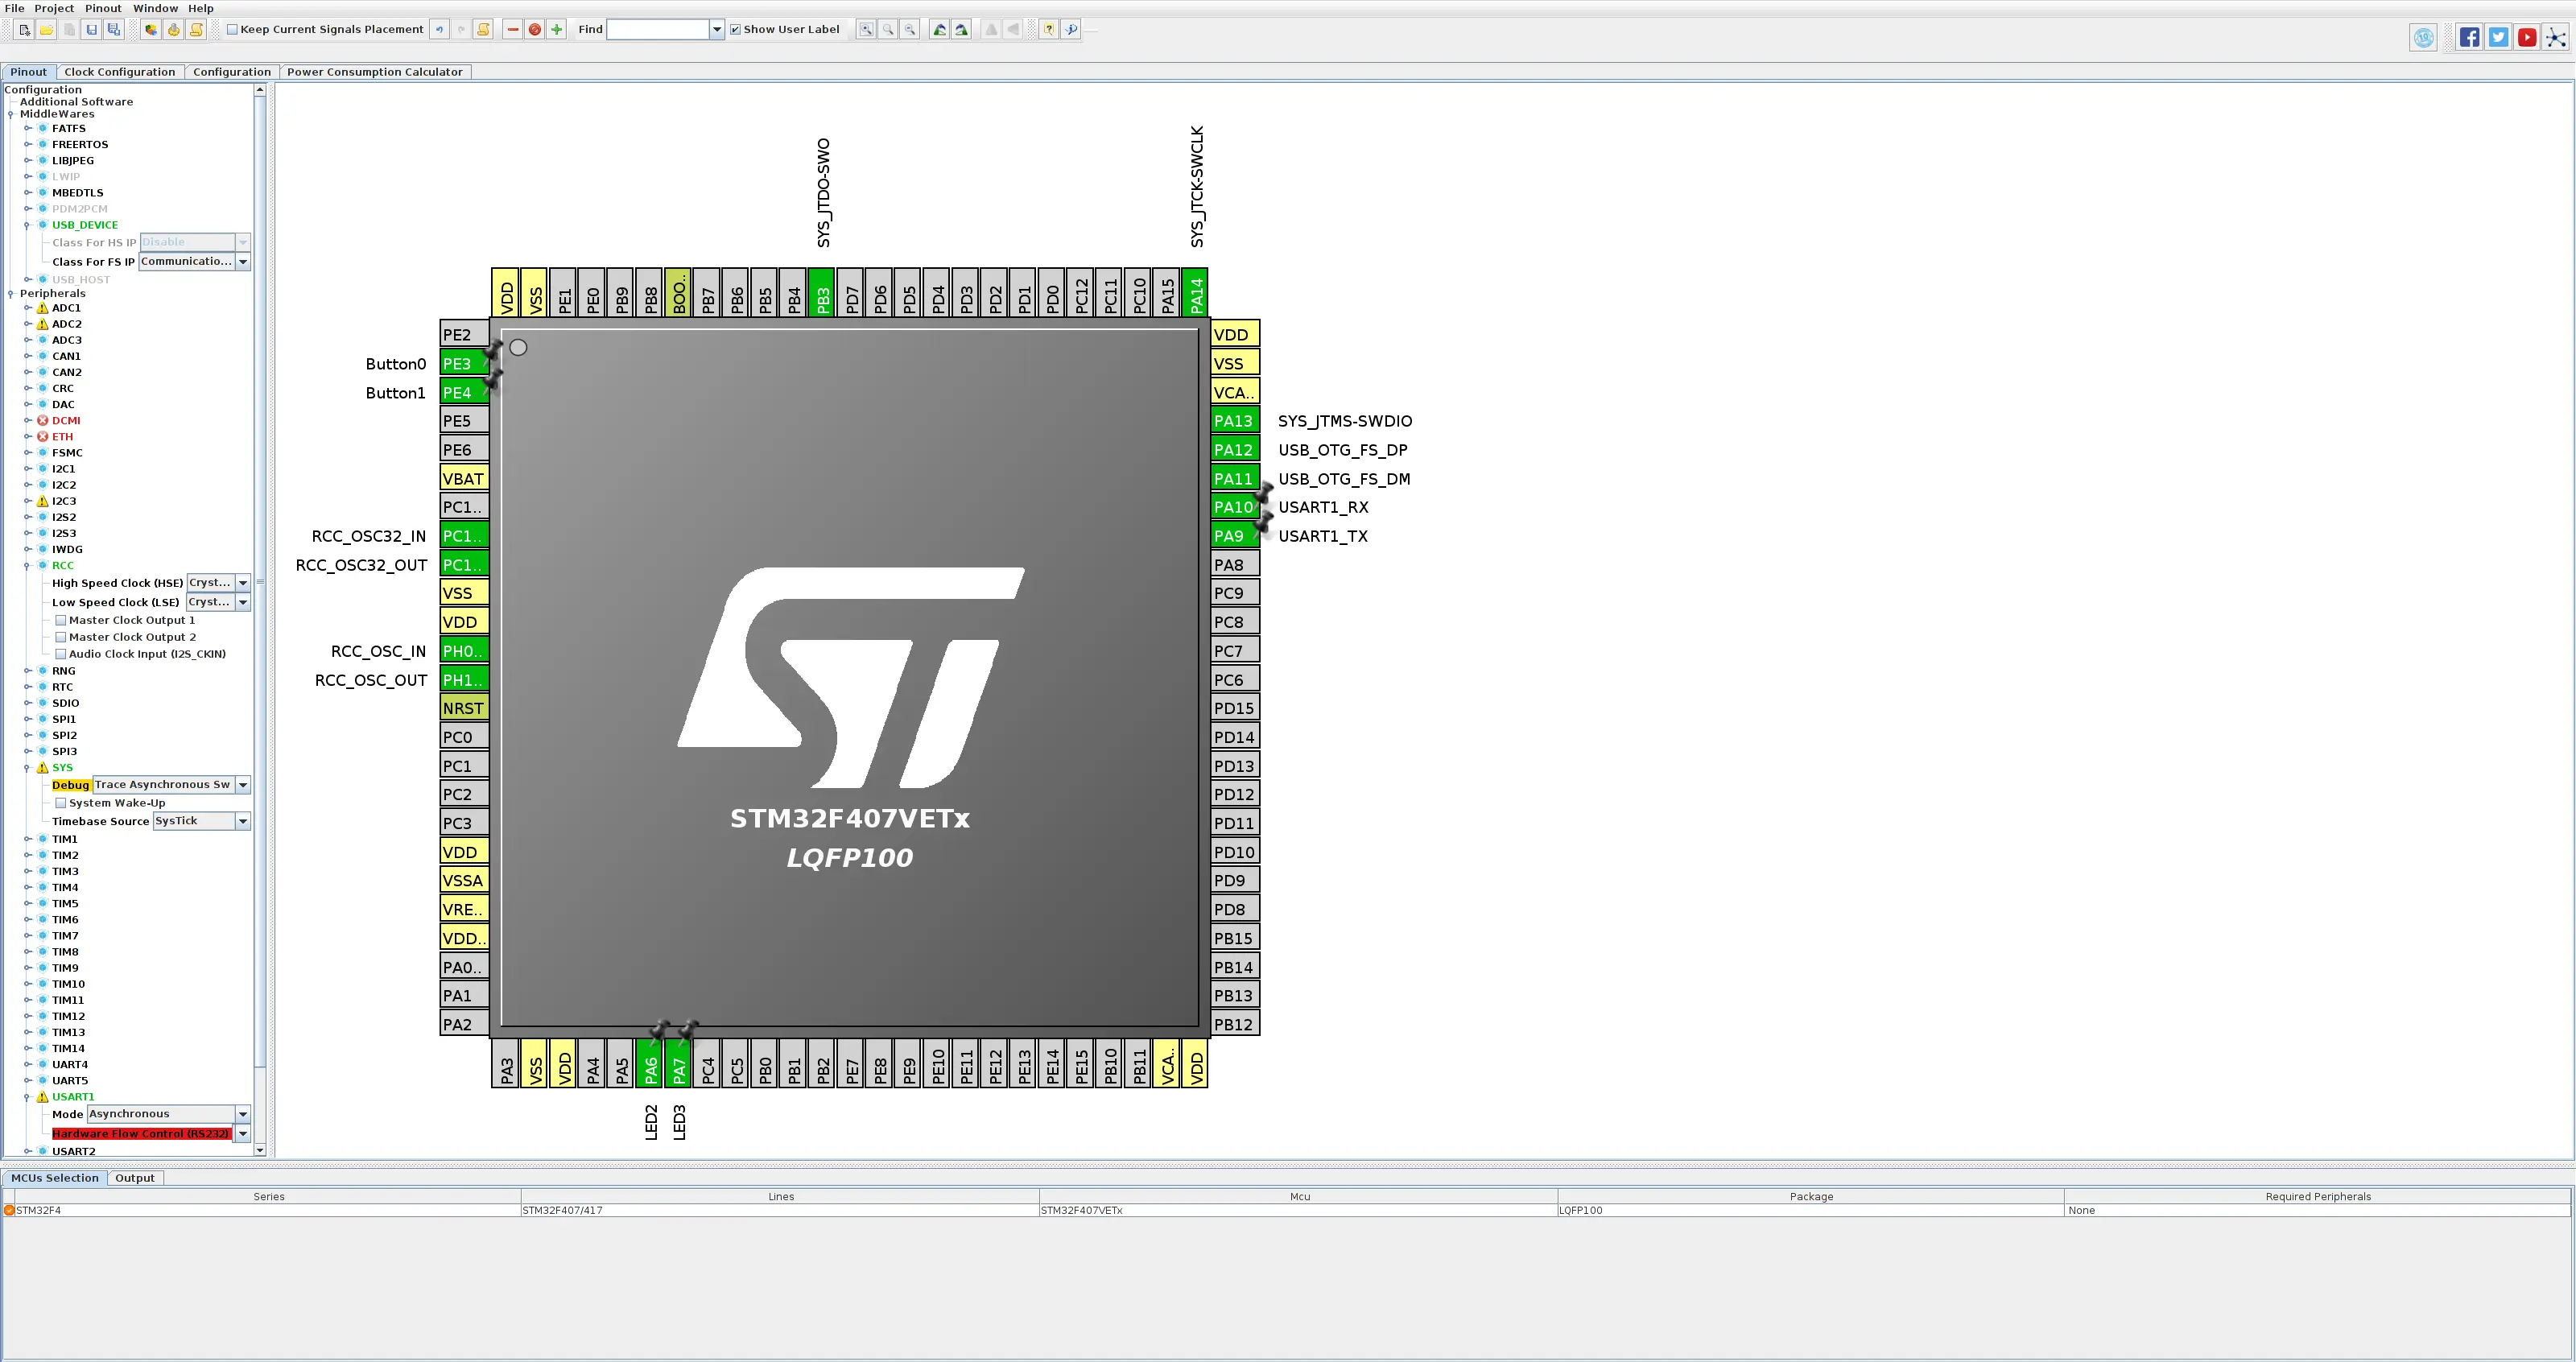
Pinned Out
Above, I have mapped out some of the peripherals I would like for this demo.
The UART is mapped out to PA9 and PA10 and the debug option is setup to Trace Async which enables both SWD debug support as well as the SWO pin as the trace output channel.
I will be using one of the buttons for input into the system so that we can have a method of trigging the debug text.
Moving to the next tab, we can setup the system clocks. For this example, I have setup the main crystal frequency to be 8MHz to match the development board as well as bump up the main system frequency to maximum.

MCU Clocks
The next tab along, allows us to setup the peripherals and middleware layers.

Setup
From here we can select the UART to setup its baud rate
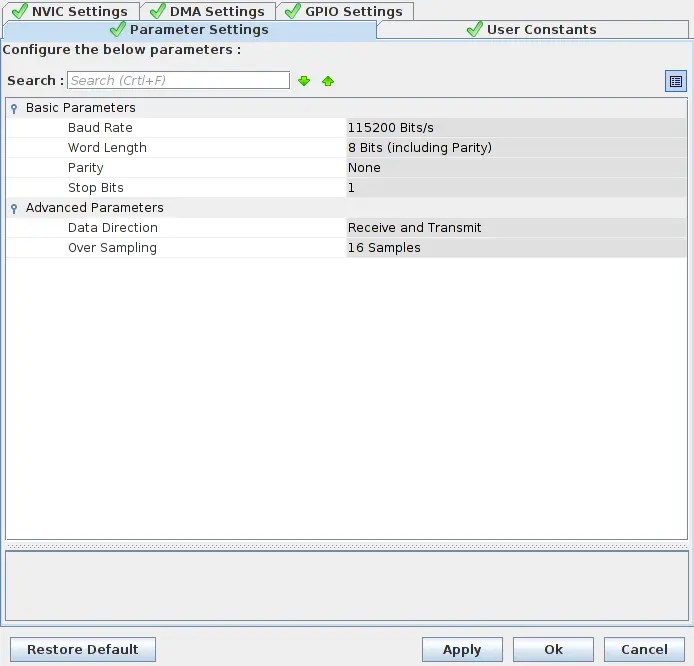
Setup
Enable the interrupt for future
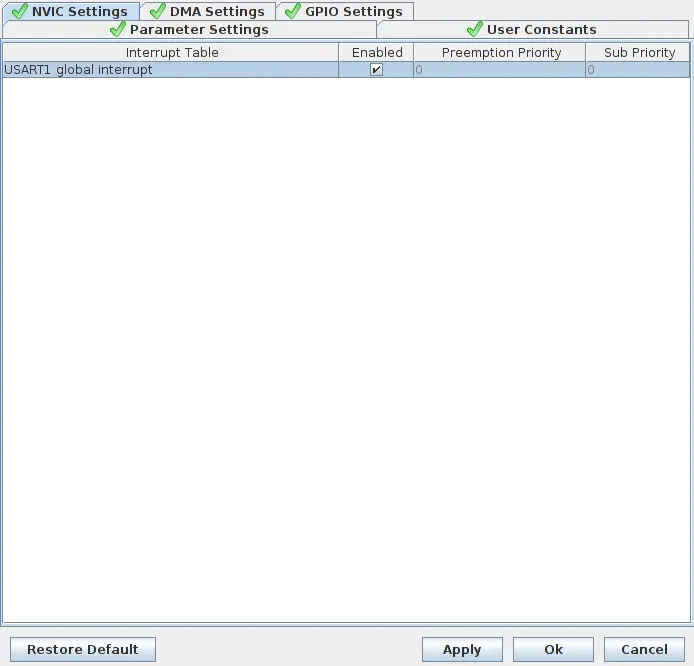
Setup
And also enable DMA channels for the UART so we can offload the transmitting of the buffers.
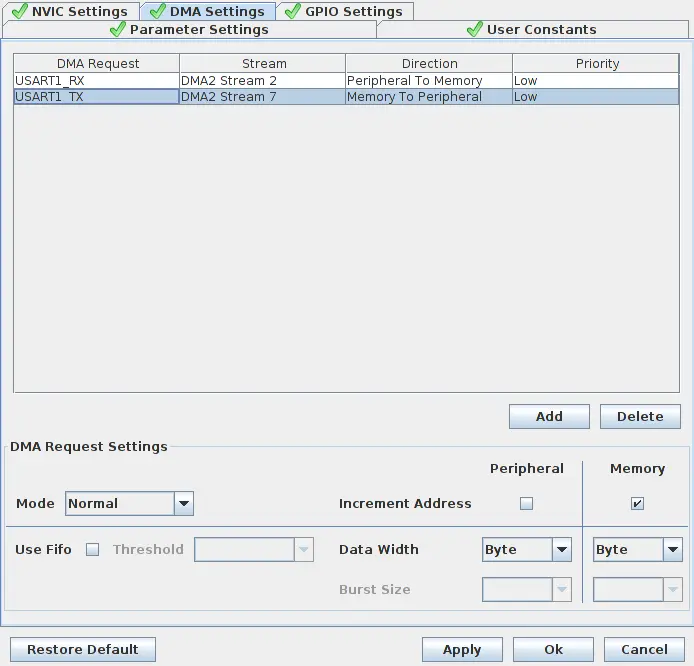
Setup
After this we can use default options for the rest of the system setup.
Make sure to setup your project settings for your IDE of choice, here I am using the Atollic IDE.
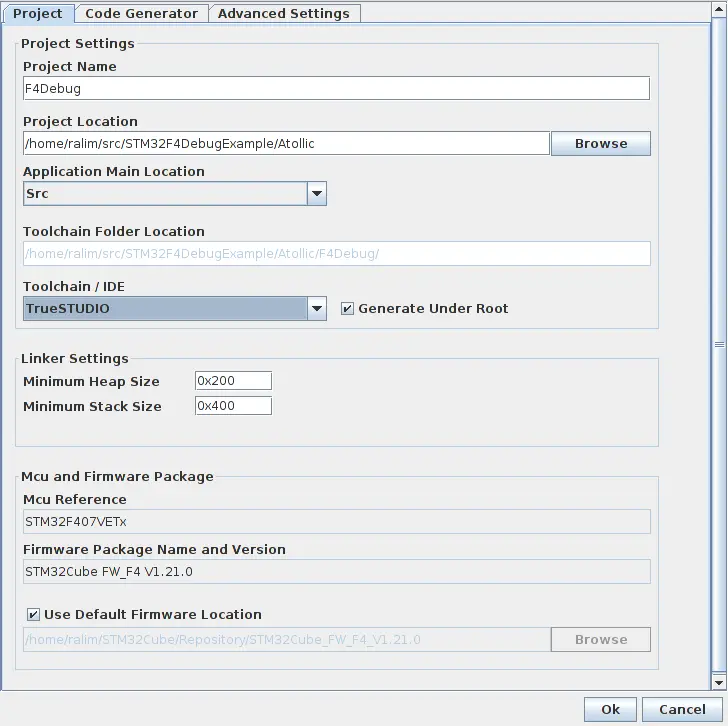
Project
I strongly reccomend setting up full assert option when you are first developing, you can turn this off later if you feel the need.

Project
After this, export the code and start to load it up in the Atollic IDE.
Import the project into Atollic
When you first open Atollic you will first be asked to select your workspace.

Workspace
After this, you will need to import the project into your workspace. This can be acheived by right clicking in the left hand side column and selecting the import option.
We want to use the option Import existing projects into workspace.
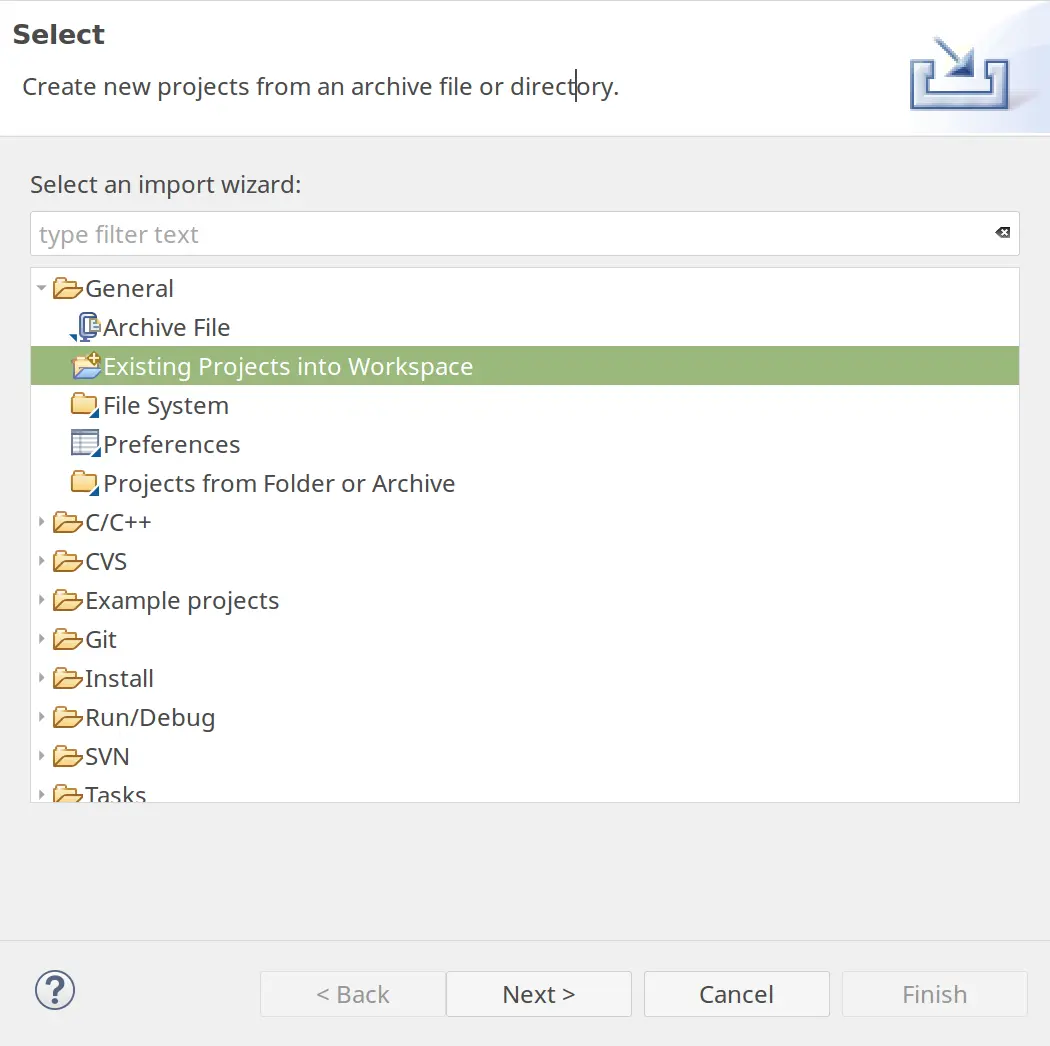
Project
After this at the top we need to select the folder to search so that our project can be found, and then we can click through OK to complete the import.
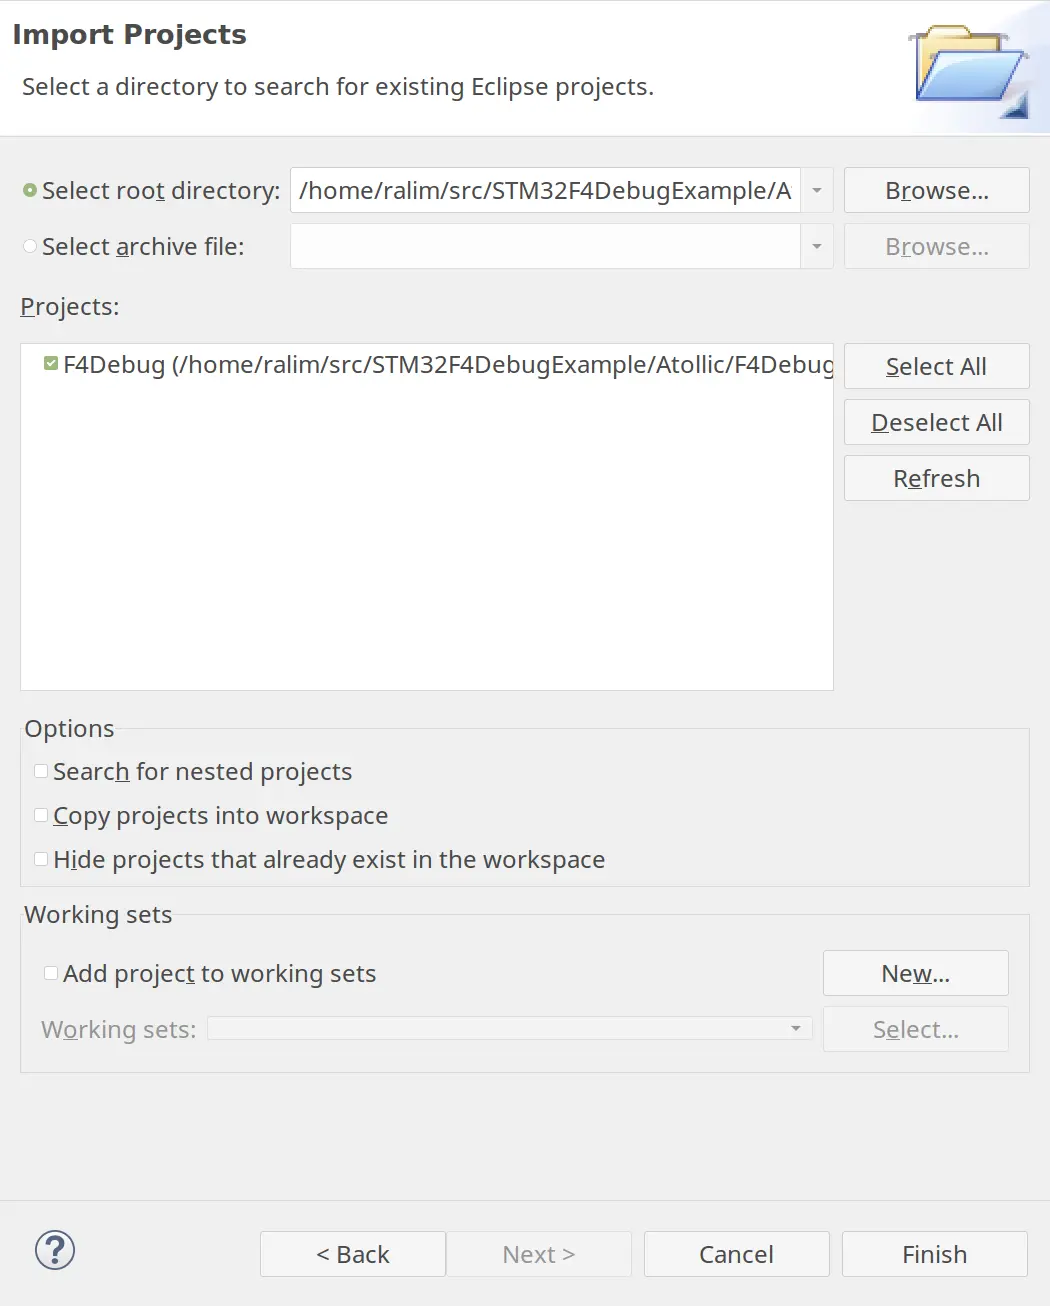
Project
After this you should be left with the project imported on the left, and you should be able to build the code to test that everything has been imported correctly.
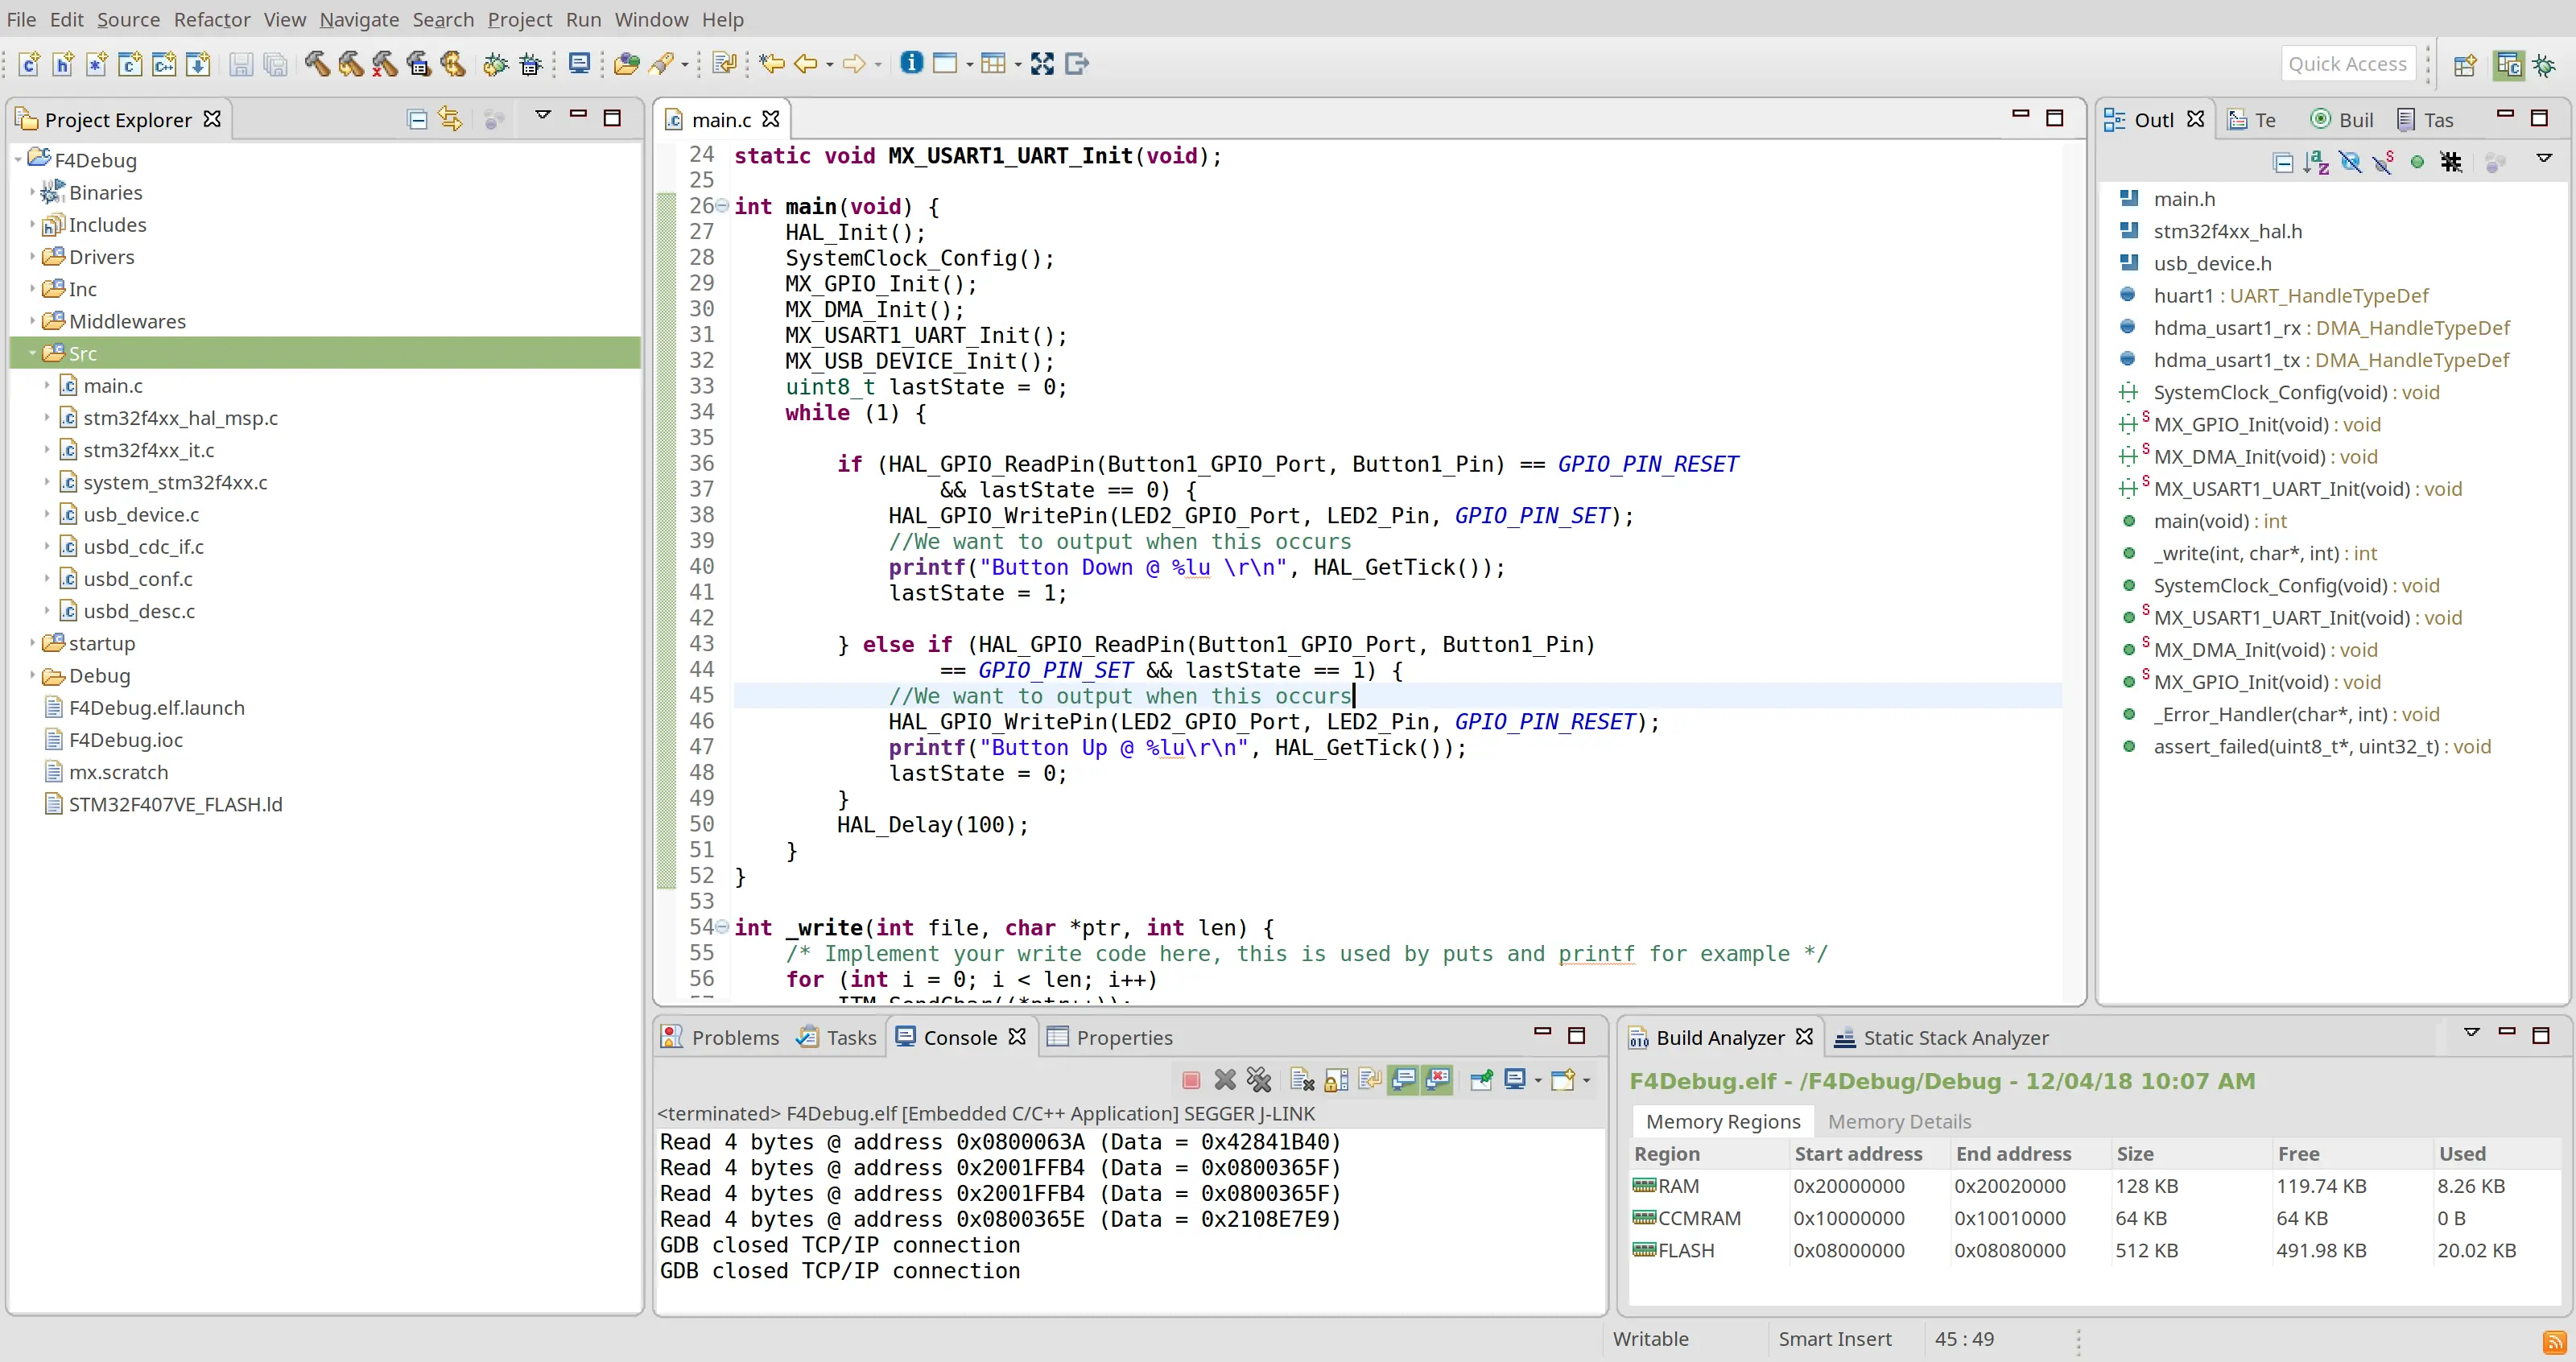
Project
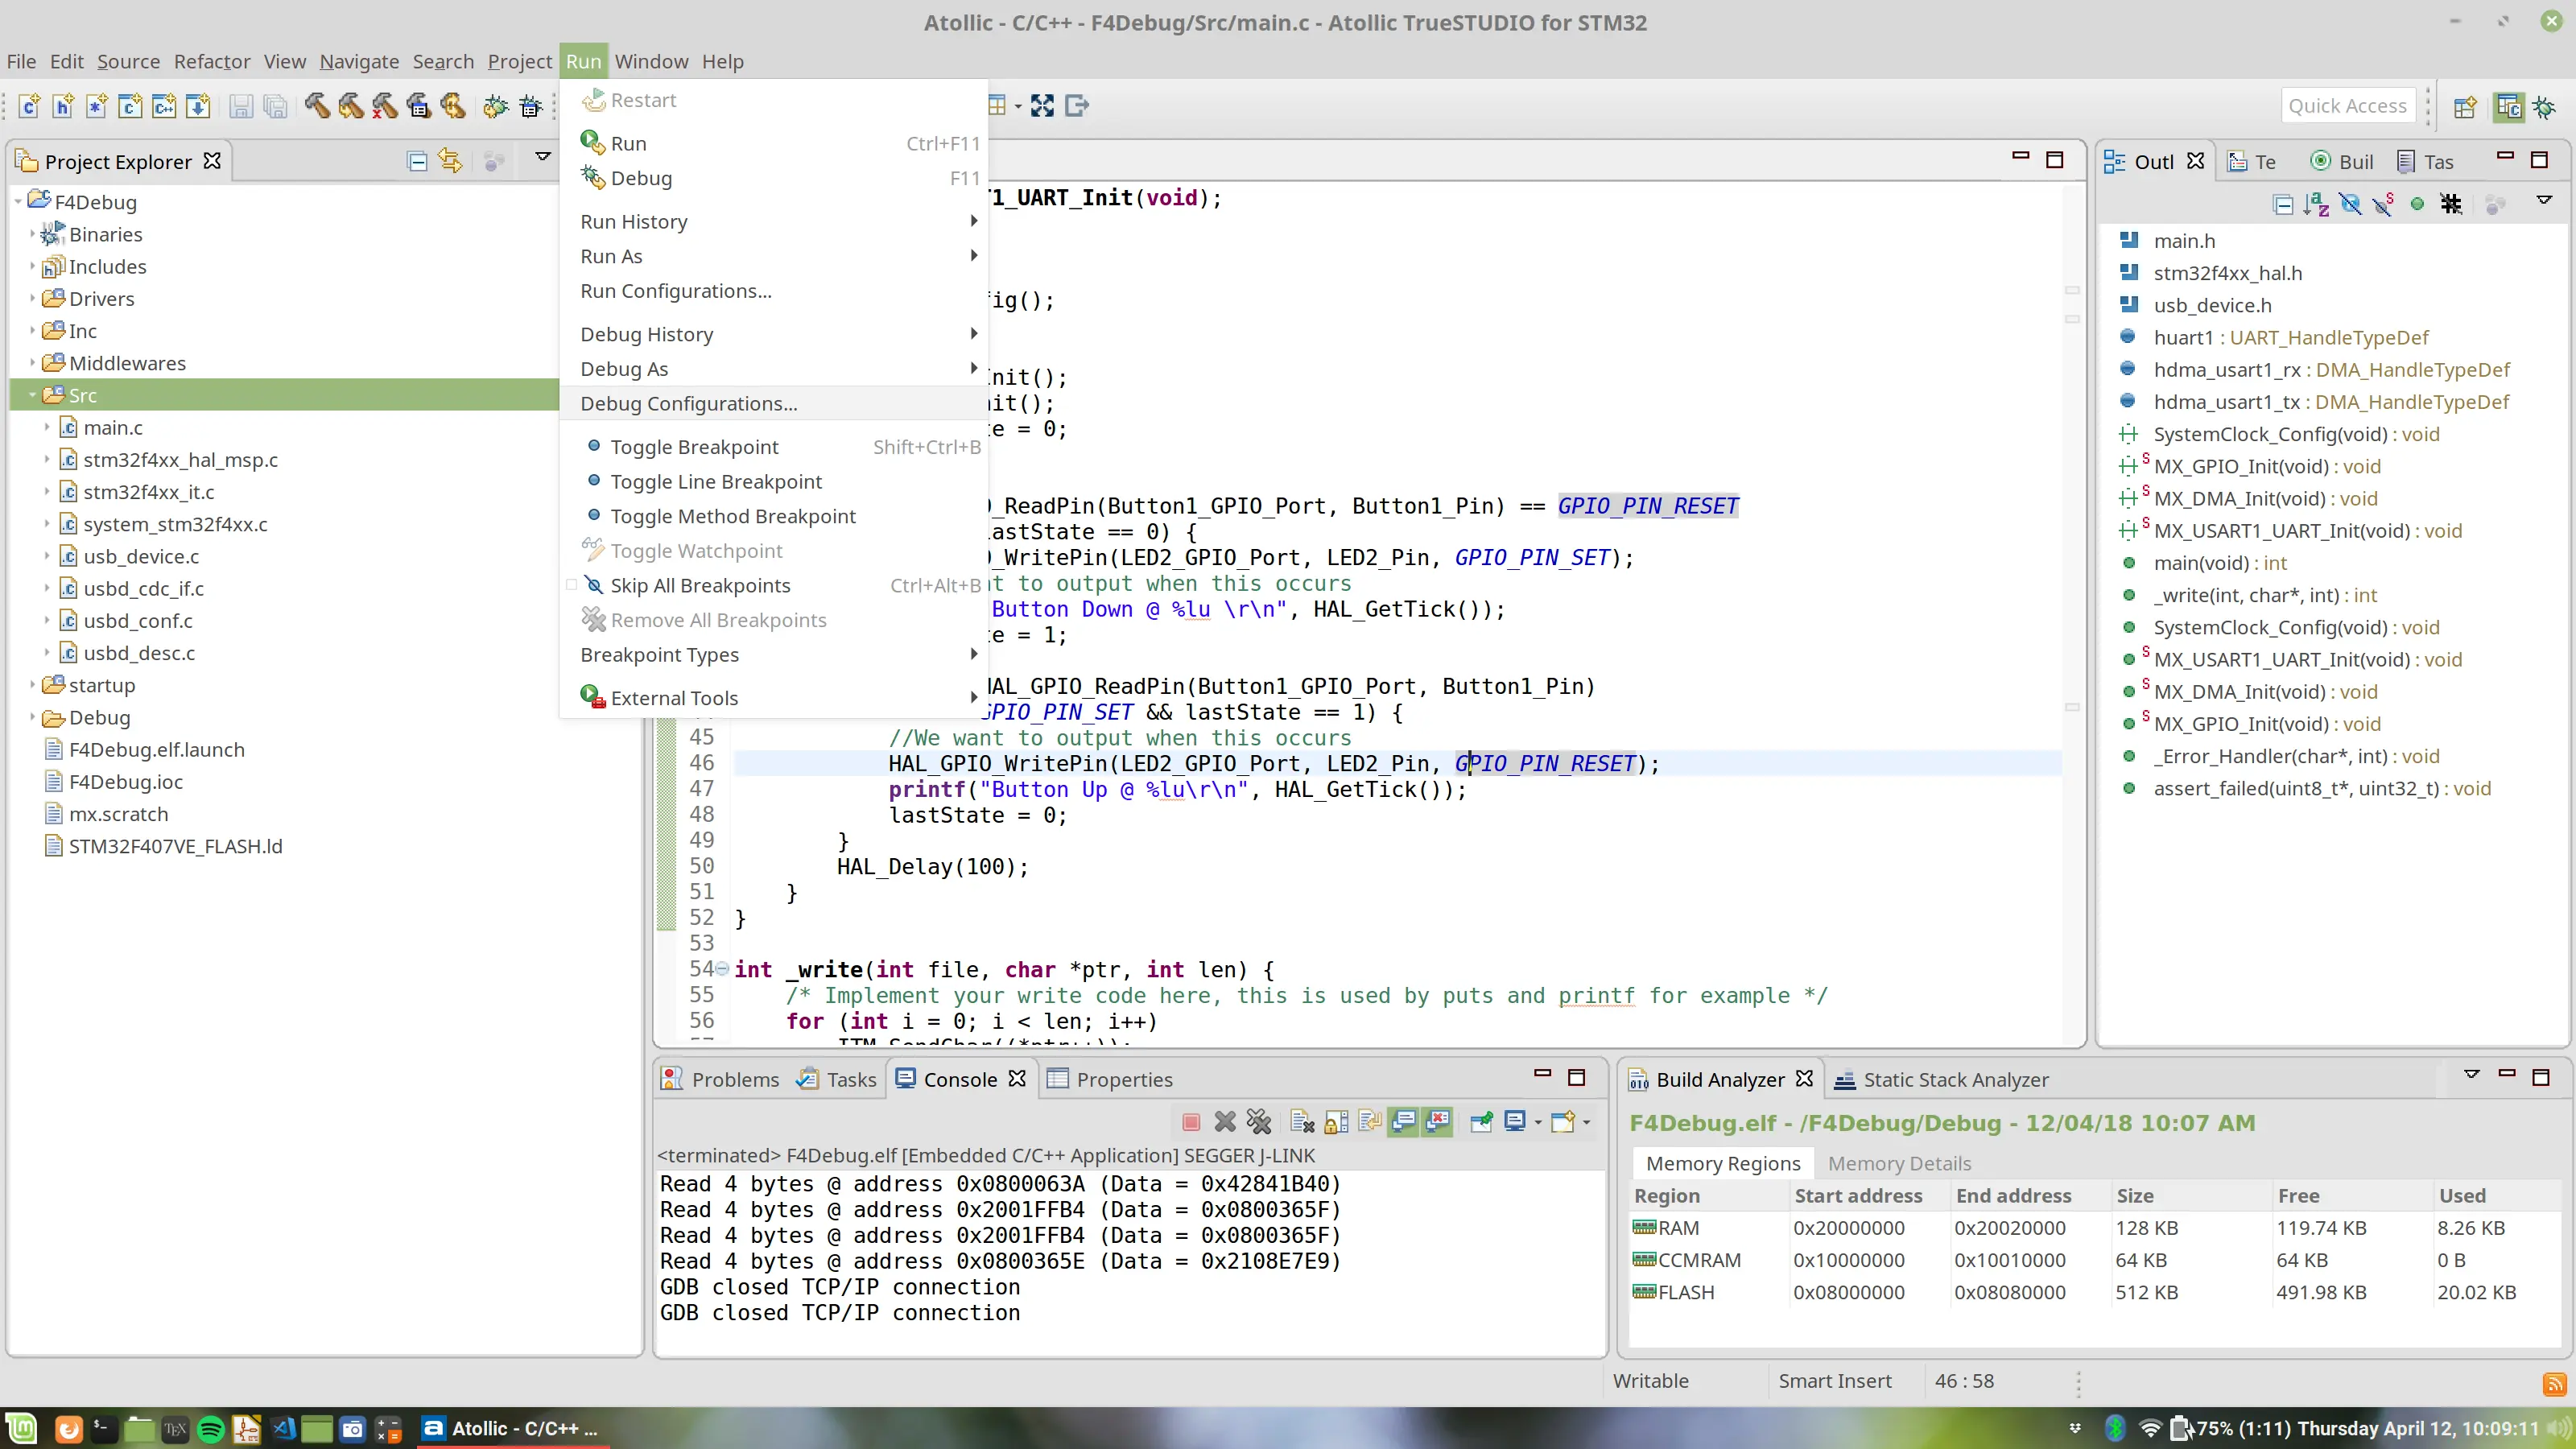
After this, I have added some template code to allow us to test our ability to debug using printf() calls.
This i the code block that I have used to allow me to trigger debug statements using a button. Its nothing fancy at all, just a minimal demo.
Note that you want to have some way to slow down the debug output or else your output device might not be able to keep up.
int main(void) {
  HAL_Init();
  SystemClock_Config();
  MX_GPIO_Init();
  MX_DMA_Init();
  MX_USART1_UART_Init();
  MX_USB_DEVICE_Init();
  uint8_t lastState = 0;
  while (1) {
    if (HAL_GPIO_ReadPin(Button1_GPIO_Port, Button1_Pin) == GPIO_PIN_RESET
        && lastState == 0) {
          HAL_GPIO_WritePin(LED2_GPIO_Port, LED2_Pin, GPIO_PIN_SET);
          //We want to output when this occurs
          printf("Button Down @ %lu \r\n", HAL_GetTick());
          lastState = 1;
    } else if (HAL_GPIO_ReadPin(Button1_GPIO_Port, Button1_Pin)
        == GPIO_PIN_SET && lastState == 1) {
          //We want to output when this occurs
          HAL_GPIO_WritePin(LED2_GPIO_Port, LED2_Pin, GPIO_PIN_RESET);
          printf("Button Up @ %lu\r\n", HAL_GetTick());
          lastState = 0;
    }
    HAL_Delay(100);
  }
}
Setting up SWO based debugging
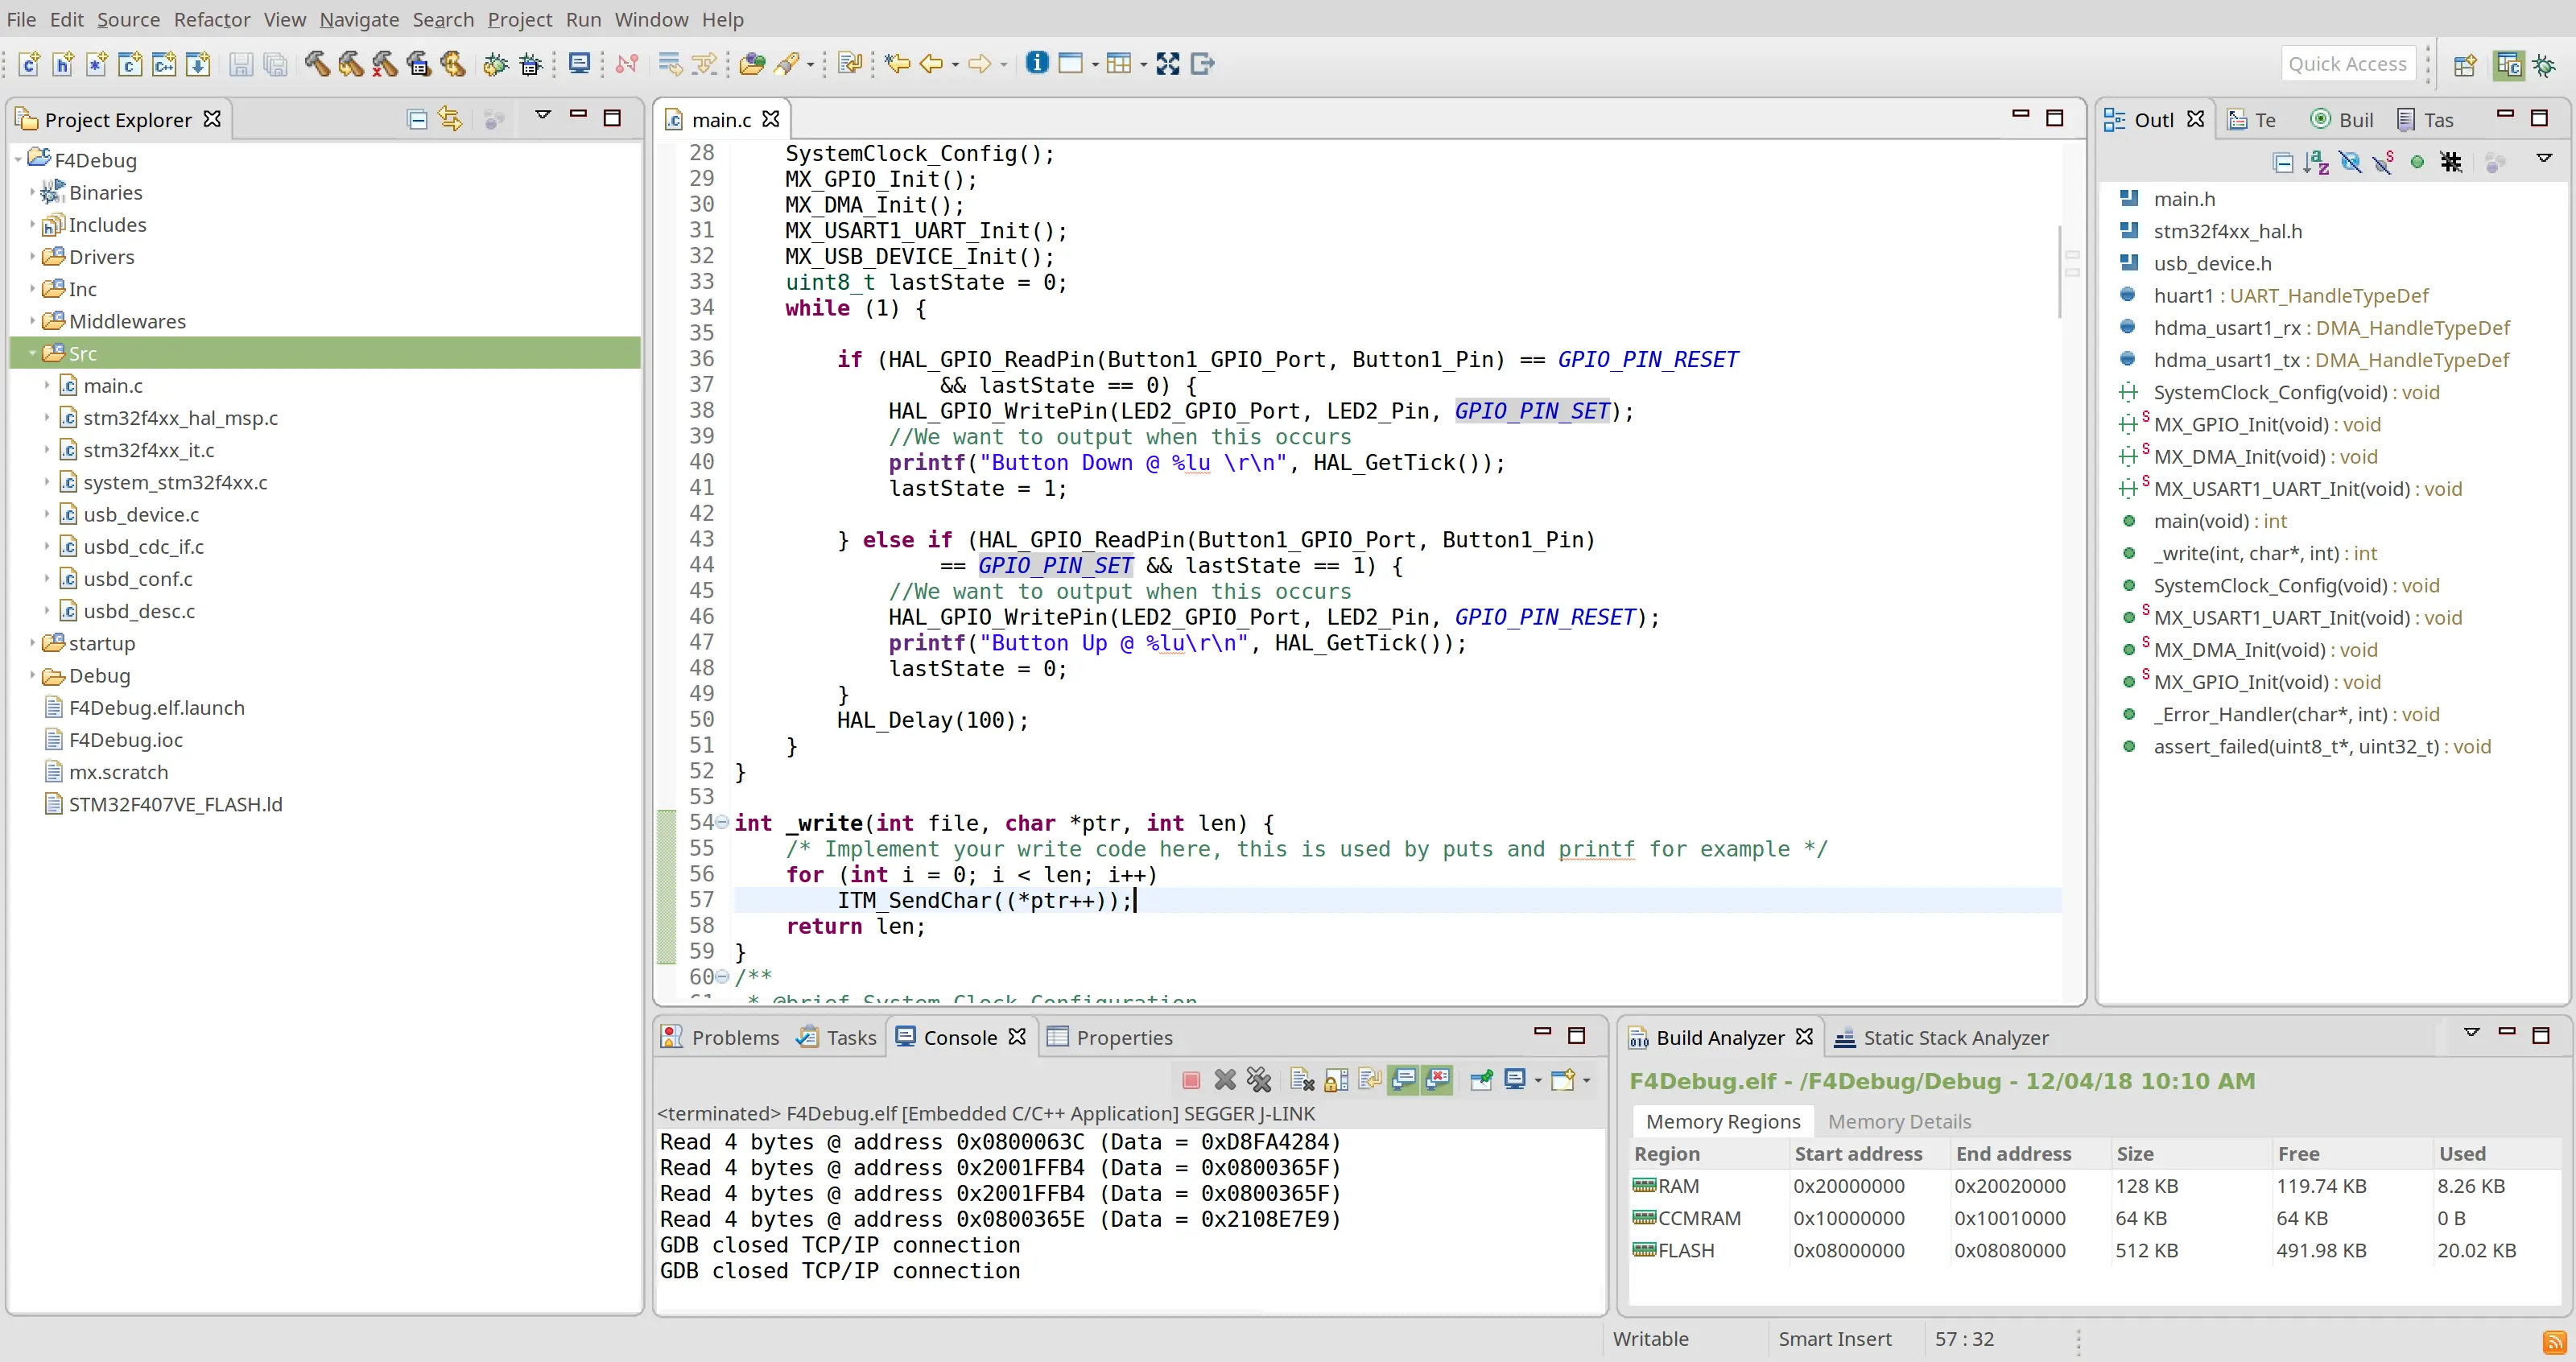
__write function (SWO)
To be able to use the SWO based debugging, we want to redirect the output from the printf() command to the trace module.
When printf() is called, it creates a buffer for the content and then sends this to the __write() command to output this to the relivant location.
This has the function definition of int _write(int file, char *ptr, int len), where we have a buffer (ptr) and a number of characters to write (len). We ignore the file number for this example.
To redirect the buffer to the trace module, we need to feed the characters into the command ITM_SendChar(char).
We can do this easily by just iterating through the buffer and feeding these in.
This creates our final function as follows.
int _write(int file, char *ptr, int len) {
  /* Implement your write code here, this is used by puts and printf for example */
  for (int i = 0; i < len; i++)
    ITM_SendChar((*ptr++));
  return len;
}
Which is a nice and simple to maintain.
Code
Viewing SWO data in Atollic
In the Atollic framework, first we need to goto the debug configuration.
Debug Configuration
Project
In here we need to tell the debug adapater that our system core is running at 168MHz, and select the output rate that we would like the SWO port to run at. This is outlined in the black box.

Project
Once this has been enabled, the debug adapater will now setup the SWO port for you when you turn it on (it will directly write to the registers to enable it).
Enable SWO Capture
The first time after setting up the SWO in the debug settings, we need to tell the adapter which SWO features we want to enable.
The ITM_SendChar command sends the character out of stream 0 so we need to tick this for our debug probe to capture this stream.
Start your program into debug mode.
Then we need to select the configuration ofr the SWO capture
Project
In this window we need to enable the stream 0

Project
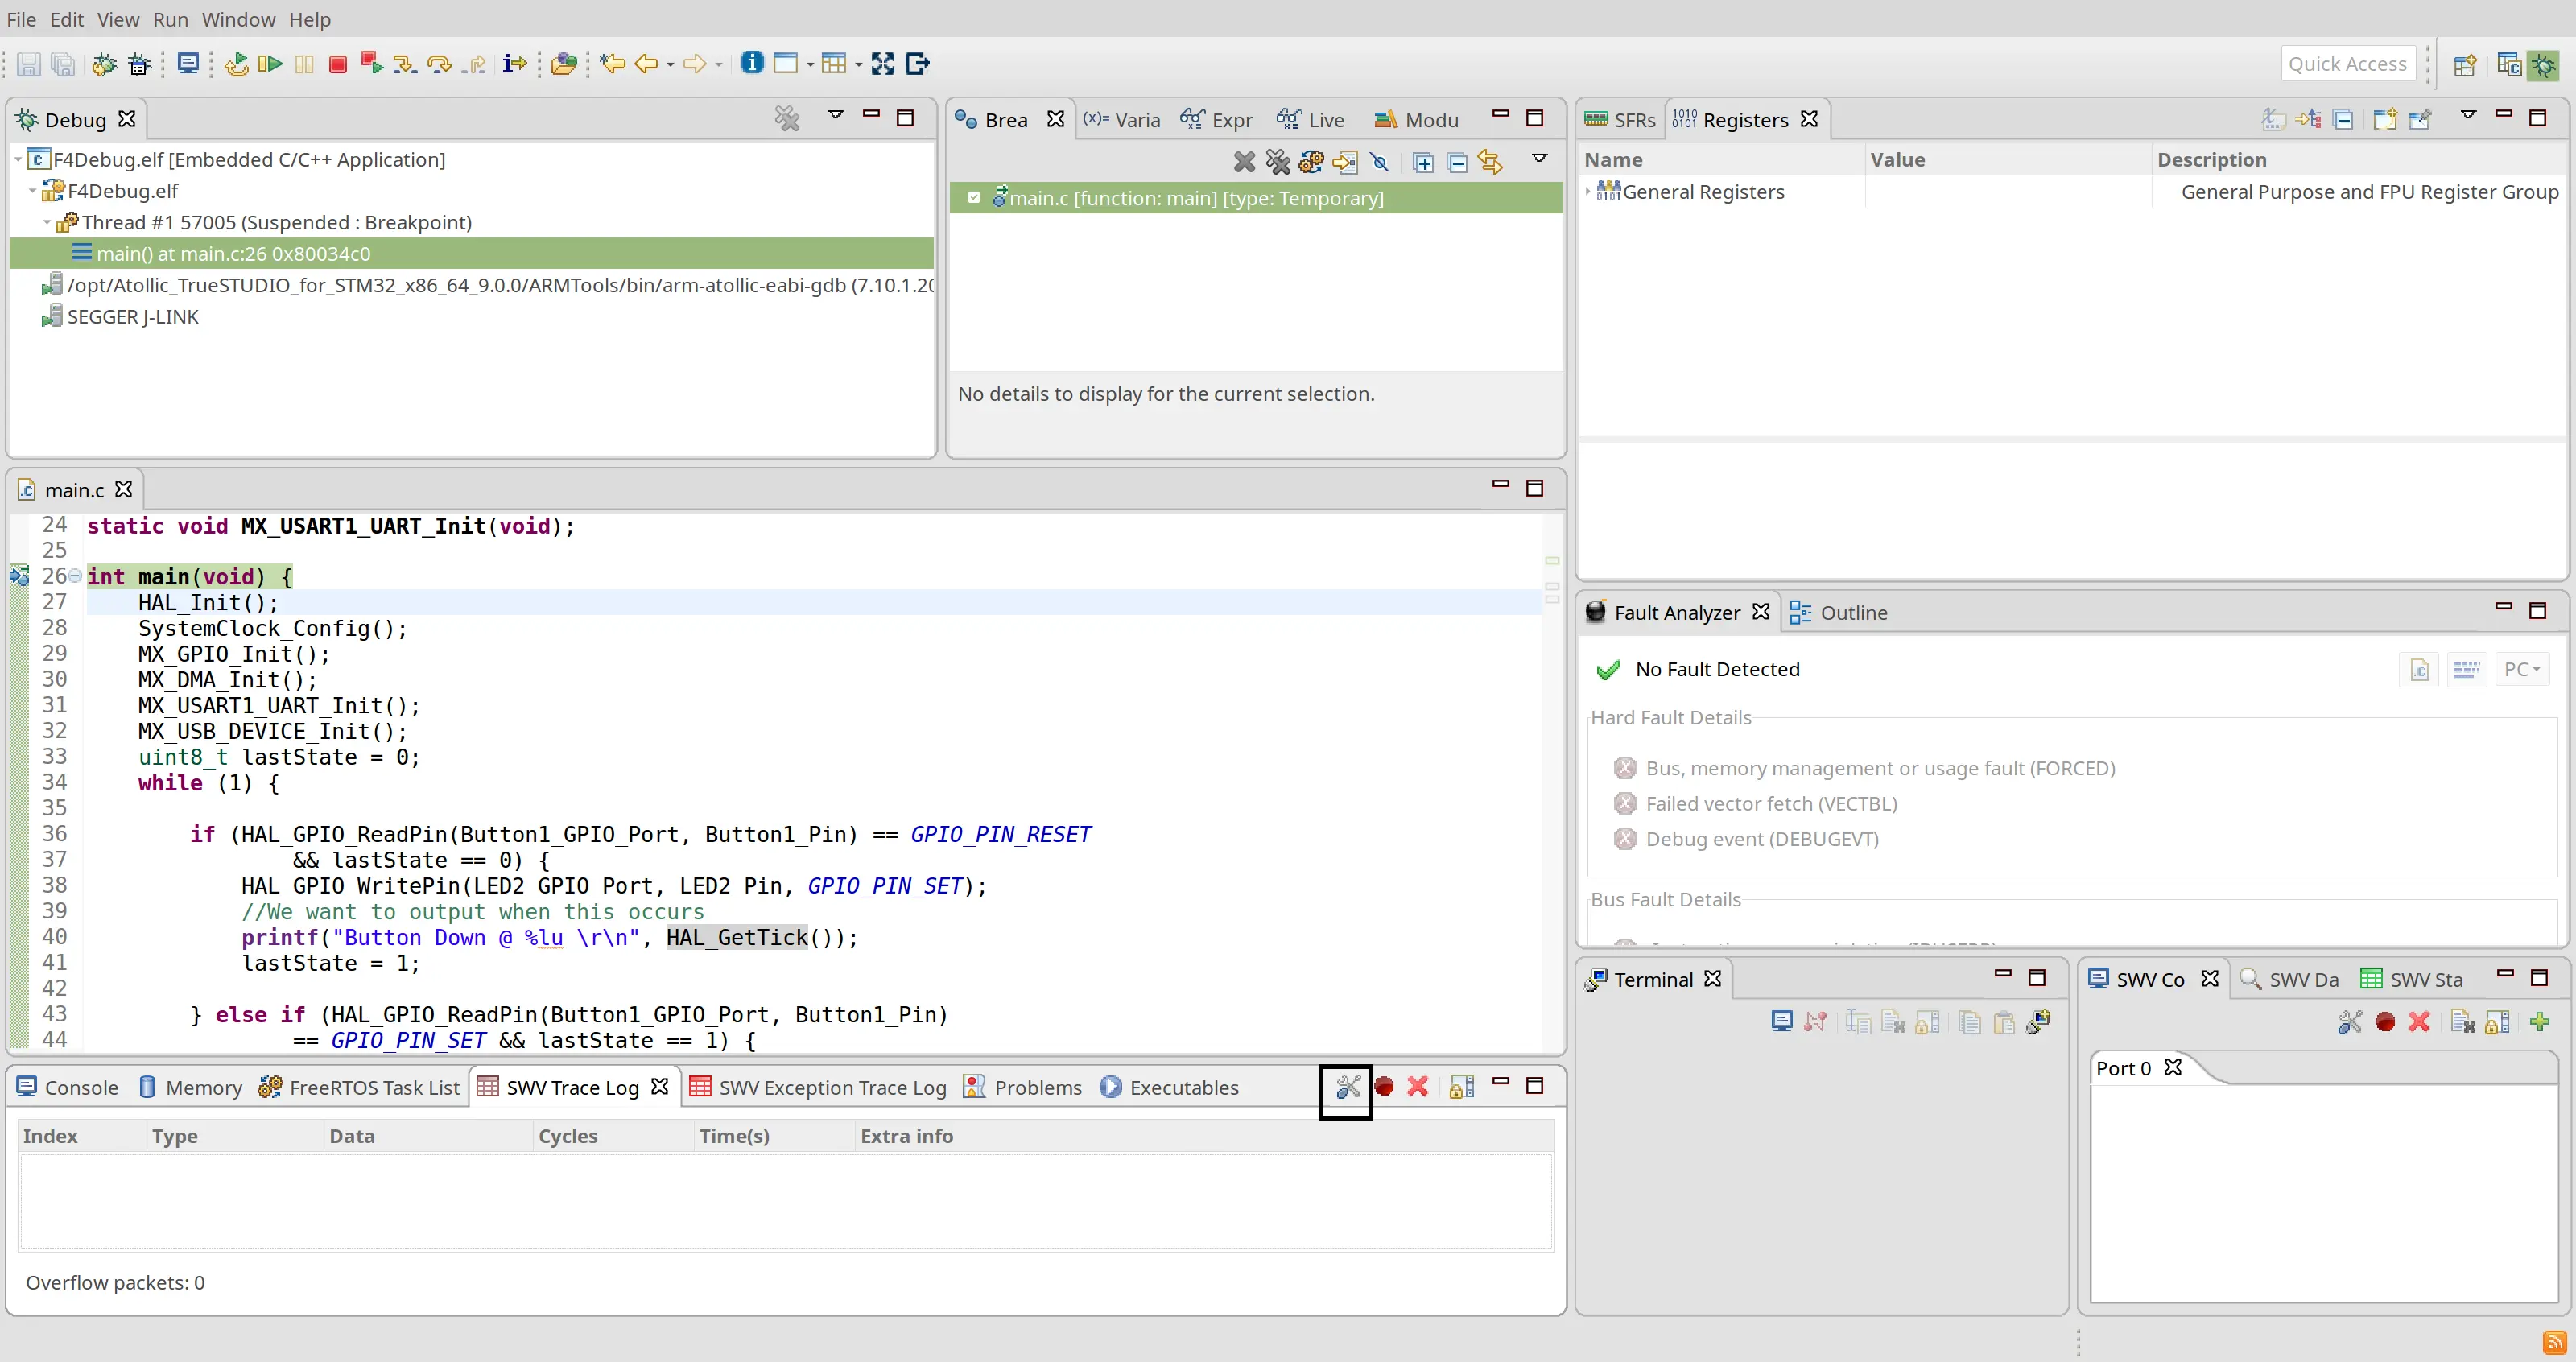
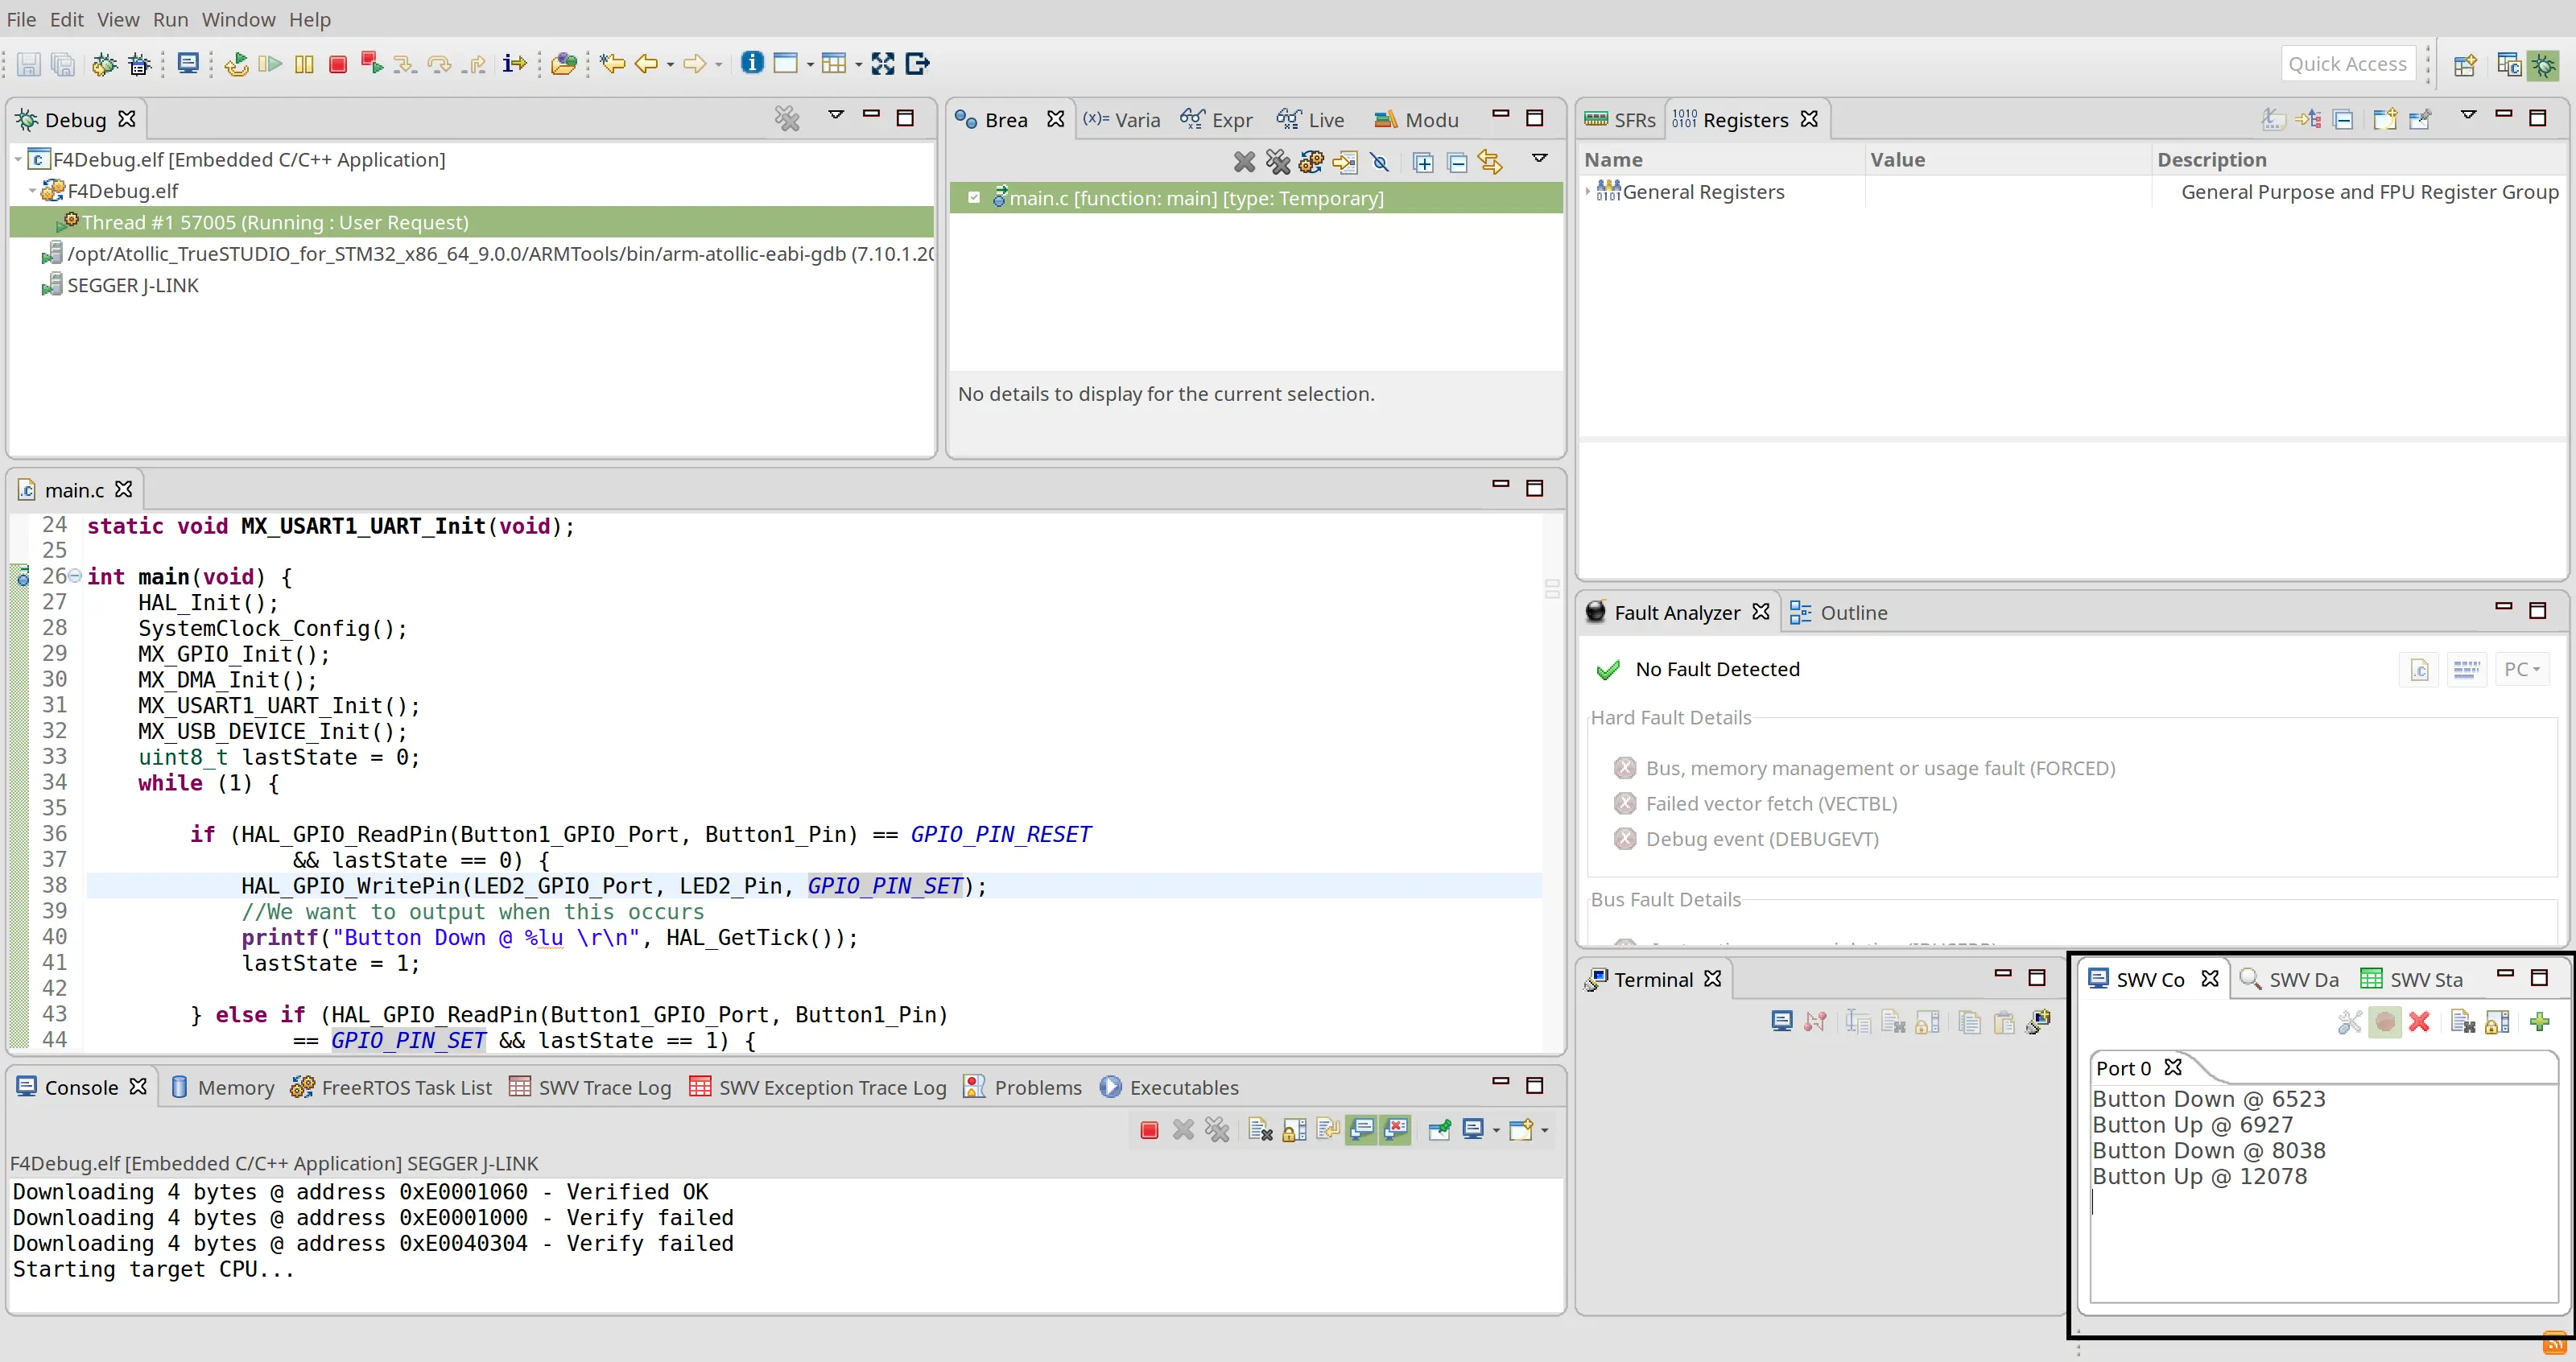
Enable SWO Capture in your session
In each session where you would like to capture and view the SWO data, we need to start the capture.

Project
The highlighted button starts the capture, and must be run with your program paused as it needs to setup some of the registers on the STM32.
After this, you can start your program and all the data will appear in the stream view.
Project
Setting up UART based debugging
__write function (UART)
To be able to use the UART based debugging, we want to redirect the output from the printf() command to the UART module.
When printf() is called, it creates a buffer for the content and then sends this to the __write() command to output this to the relivant location.
This has the function definition of int _write(int file, char *ptr, int len), where we have a buffer (ptr) and a number of characters to write (len). We ignore the file number for this example.
To redirect the buffer to the trace module, we need to feed the characters into the HAL command to stream this data out. For this example I’m double buffering this into a local buffer so that we can use DMA to transmit the data and not block the CPU execution. However for clarity I’m not using a nice FIFO, so the second call may be blocked until the first has transmitted.
This creates our final function as follows.
char uartdebugBuffer[256];
int _write(int file, char *ptr, int len) {
  while (huart1.gState != HAL_UART_STATE_READY) {
    //Kill time waiting for previous transfers
    HAL_Delay(10);
  }
  memcpy(uartdebugBuffer, ptr, len);
  HAL_UART_Transmit_DMA(&huart1, uartdebugBuffer, len);
}
Which is a nice and logical with fairly low overhead.
Debugging
There is no special setup required for UART debugging. Just start your program and read the output.
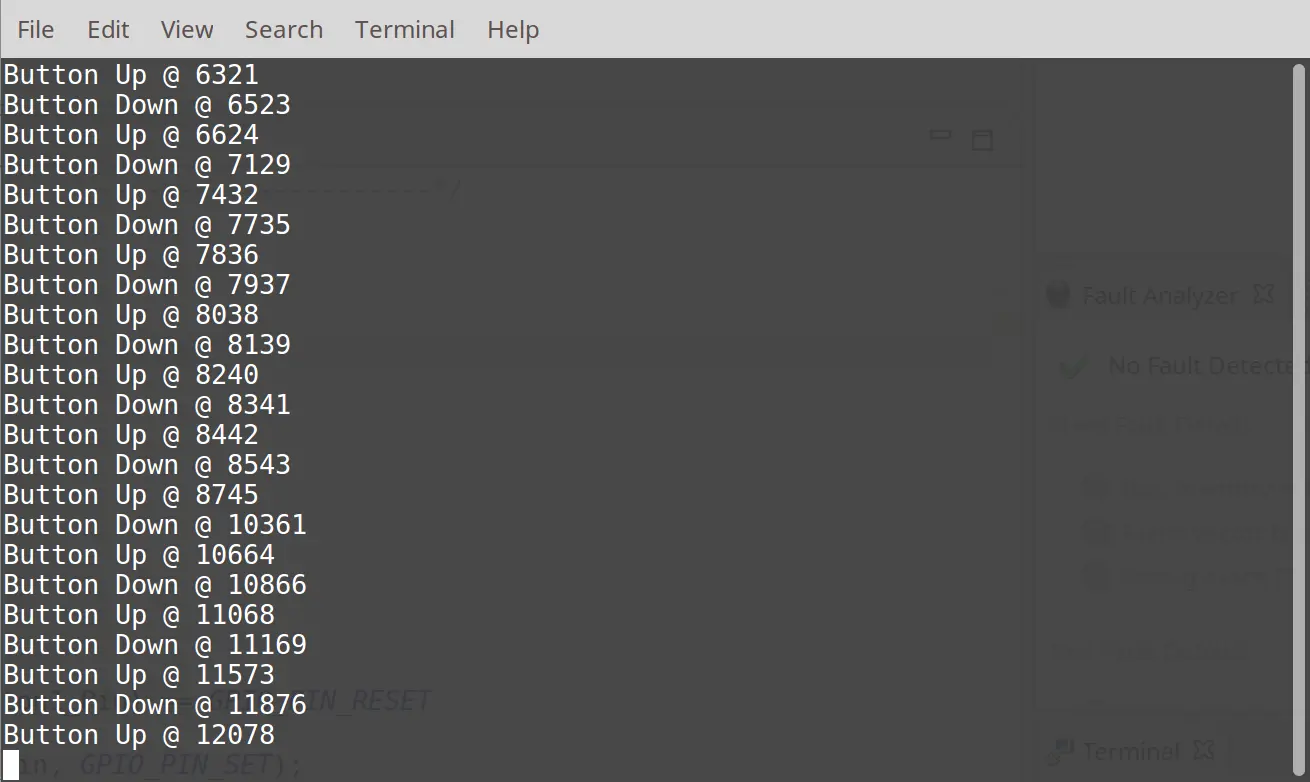
UART